Heavy metals and cannabis
- Like
- Digg
- Del
- Tumblr
- VKontakte
- Buffer
- Love This
- Odnoklassniki
- Meneame
- Blogger
- Amazon
- Yahoo Mail
- Gmail
- AOL
- Newsvine
- HackerNews
- Evernote
- MySpace
- Mail.ru
- Viadeo
- Line
- Comments
- Yummly
- SMS
- Viber
- Telegram
- Subscribe
- Skype
- Facebook Messenger
- Kakao
- LiveJournal
- Yammer
- Edgar
- Fintel
- Mix
- Instapaper
- Copy Link
Posted: 23 April 2020 | Bob Lockerman, Jon Peters, Robert Thomas | No comments yet
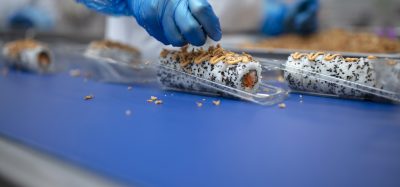
The challenges of measuring heavy metals in cannabis and cannabis-infused products.

The lack of federal oversight with regard to measuring contaminants in cannabis and cannabis-infused food products made in the US has meant that it has been left to the individual states to regulate the use of cannabis.
Marijuana (both medical and recreational) is legal in 33 states and the District of Columbia (Washington, DC).1 However, the cannabis and hemp plants are known to be hyperaccumulators of contaminants such as heavy metals in the growing medium, soil, fertiliser and nutrients, so it is critical to monitor levels of elemental contaminants to ensure that cannabis and its food-based products are safe to consume.2
State-based regulations
The majority of states in the US require manufacturers of these products to show compliance by measuring four major heavy metals: lead (Pb), arsenic (As), cadmium (Cd) and mercury (Hg). All must be below maximum limits, based mainly on regulations set by the pharmaceutical industry in USP Chapter 232 and ICH Q3D guidelines.3,4 California, which is considered to be the gold standard in regulating cannabis and hemp, dictates that oral (edibles) and inhaled (vapes) cannabis products are safe to consume only if these four heavy metals are present a levels below those shown in Table 1, based on typical consumption of 10g/day.5
At these extremely low contaminant levels, it is critically important that the optimum sampling, sample preparation and testing procedures are implemented, so the test results of the samples being analysed are not only accurate, but also indicative of the cannabis and cannabis products being tested.
Below: Table 1 – Heavy metal limits in cannabis and hemp required by the state of California
|
Element |
Maximum limit (edibles) µg/g |
Maximum limit (Inhaled products) µg/g |
|
Pb |
0.5 |
0.5 |
|
As |
1.5 |
0.2 |
|
Cd |
0.5 |
0.2 |
|
Hg |
3.0 |
0.1 |
Analytical procedures
The state of California requires that at least half a gram of sample is taken for testing purposes and recommends that inductively coupled plasma mass spectrometry (ICP-MS) is used to carry out the measurements. ICP-MS is a sophisticated multielement analytical technique, capable of measuring down to parts per trillion (ppt) levels using mass spectrometry to identify and measure positively charged ions, which are generated in an extremely energetic argon plasma at approximately 6,000-7,000°C.6 However, this method is predominantly a solution technique, which means that any solid samples must be dissolved/digested before being presented to the instrument. Most cannabis-related samples are solid materials, powders, concentrates and extracts, which invites several challenges. In addition, cannabinoid oils, which are mainly hydrophobic (not miscible with water), must also be digested prior to analysis.
Microwave digestion
The most common means of dissolving cannabis samples is using microwave digestion in combination with concentrated mineral acids such as nitric acid, hydrochloric acid and/or hydrogen peroxide. Microwave technology offers clear benefits over traditional hot block digestion, owing to the higher temperatures achieved in the closed vessel. Typical microwave digesting temperatures are in excess of 200°C compared to the boiling point of a concentrated mineral acid mixture of around 120°C in a convention hot block system.
Although the oxidation reaction is efficient at 200°C, microwave digestion techniques tend to generate large amounts of gases such as carbon dioxide (CO2) and nitrogen dioxide (NO2) when they react with plant-type samples such as cannabis and its many associated products. The microwave system and its components must therefore not only accommodate the high temperature required to digest all the different organic components in the samples, but also be able to handle the subsequent increase in pressure produced by the generation of large volumes of these gases. Unfortunately, the higher the sample weight taken, the more gases generated.
Cannabis testing labs
Cannabis testing labs are tasked with characterising an array of different sample types – from flowers and oils to tinctures and edibles – and it can be challenging to prepare these samples simply and economically.
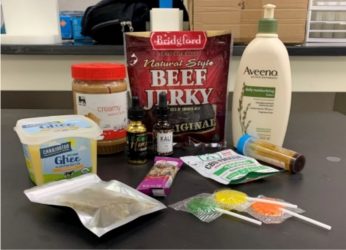
Figure 1: The range of cannabis-related samples studied
The traditional problem associated with microwave digestion systems was that the numerous samples encountered by a cannabis testing lab had to be segregated by type in order to run in the microwave. The range of matrices presented often made this a difficult task because some samples would be completely dissolved while others were only partially digested. For that reason, samples with similar matrices had to be batched together, which necessitated running multiple sample types, one matrix at a time.
However, recent developments with vessel design, sensor technology, temperature measurement and control, as well as improved software algorithms has meant that power levels can now be optimised, enabling individual sample vessels in the same batch to reach a similar temperature. This means that different matrices can be mixed in a single batch to achieve an efficient and complete digestion of all sample types.
To demonstrate the capabilities of this microwave technology (MARS 6, CEM Corp, Matthews, NC), eleven different cannabis-related samples were digested including hemp flower, hemp oil, MCT (medium chain triglyceride) oil, topical cream, crude CBD oil, beef jerky, peanut butter, ghee (butter), granola bar, gummy snacks and hard candy. Figure 1 shows the range of samples investigated.
The microwave digestion conditions are presented in Table 2, while a screenshot of the heating programme, showing the similar temperatures achieved by all 24 samples, can be seen in Figure 2.
Below: Table 2 – The microwave digestion conditions used in this study
|
Variable |
Value |
|
Sample matrix |
All 11 matrices |
|
Sample weight |
0.5g |
|
Acid mixture |
9:1 HNO3:HCl |
|
Acid volume |
10ml |
|
Sample rack capacity |
24 samples |
|
Ramp time |
20min |
|
Hold time/temperature |
15min at 210°C |
|
Cool-down time |
10min |
|
Total digestion time |
45min |
Analytical procedure
To exemplify the efficiency of digestion, five ppb of Pb, As, Cd and Hg were spiked into each vessel, prior to digestion. The resulting solutions after digestion were made up to a volume of 50ml. The solution is further diluted to bring the total acid concentration to five percent before being analysed by ICP-MS (Model 2030, Shimadzu, Corp, Columbia, MD) using the
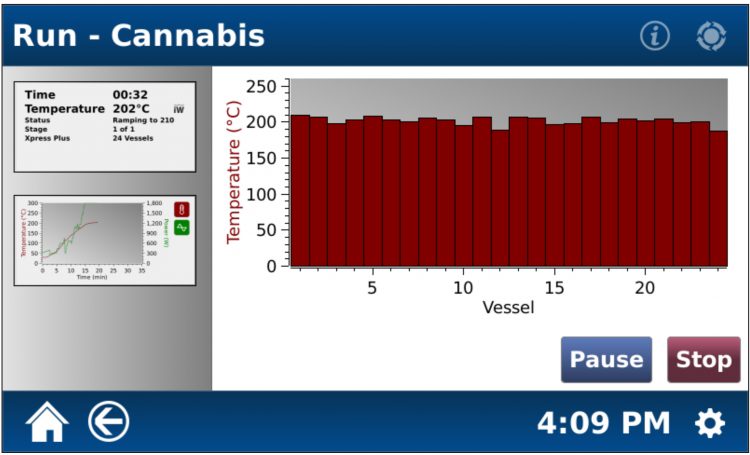
Figure 2
Niagara rapid rinse autosampler system (Glass Expansion, Pocasset, MA) to optimise sample delivery and washout to improve sample throughput by a factor of two.
For lotions, creams and hemp flower that might contain silica (SiO2) or titanium dioxide (TiO2), it is normal to add several drops of hydrofluoric acid to aid the digestion. However, for safety reasons it was not used in this study, so those samples were filtered prior to making up to volume.
Results
The results for the spike recovery study are shown in Tables 3 and 4. Concentrations of elements are in ppb in the digested solutions of the original samples, together with the percentage spike recoveries of five ppb.
Below: Table 3 – Concentrations (ppb) of As, Cd, Hg and Pb in the digestion blank, hard candy, granola bar, lotion, gummy bear and hemp flower, together with % spike recoveries of 5 ppb (Note: n.d = not detected)
|
75As |
111Cd |
200Hg |
208Pb |
75As |
111Cd |
200Hg |
208Pb |
||||
|
Blank |
Mean value |
n.d. |
n.d. |
n.d. |
n.d. |
Lotion |
Mean value |
n.d. |
n.d. |
n.d. |
n.d. |
|
RSD (n = 3) |
— |
— |
— |
— |
RSD (n = 3) |
— |
— |
— |
— |
||
|
Spiked Blank |
Mean value |
5.23 |
5.23 |
5.1 |
5.08 |
Spiked Lotion |
Mean value |
4.96 |
5.09 |
5.16 |
5.03 |
|
RSD (n = 3) |
2.03 |
0.76 |
3.57 |
1.59 |
RSD (n = 3) |
11.08 |
1.21 |
3.12 |
2.62 |
||
|
Recovery (%) |
105 |
105 |
102 |
102 |
Recovery (%) |
99 |
102 |
103 |
101 |
||
|
Hard Candy |
Mean value |
n.d. |
n.d. |
n.d. |
0.0116 |
Gummy Bear |
Mean value |
n.d. |
n.d. |
n.d. |
0.0407 |
|
RSD (n = 3) |
— |
— |
— |
1.79 |
RSD (n = 3) |
— |
— |
— |
0.66 |
||
|
Spiked Hard candy |
Mean value |
5.12 |
4.92 |
5.05 |
5.13 |
Spiked Gummy |
Mean value |
4.76 |
4.9 |
4.83 |
5.07 |
|
RSD (n = 3) |
3.51 |
1.68 |
0.19 |
1.74 |
RSD (n = 3) |
0.95 |
0.74 |
1.46 |
1.92 |
||
|
Recovery (%) |
102 |
98 |
101 |
102 |
Recovery (%) |
95 |
98 |
97 |
101 |
||
|
Granola bar |
Mean value |
n.d. |
0.125 |
n.d. |
0.0186 |
Hemp flower |
Mean value |
0.0231 |
n.d. |
n.d. |
0.163 |
|
RSD (n = 3) |
— |
1.63 |
— |
3.02 |
RSD (n = 3) |
6.07 |
— |
— |
1.09 |
||
|
Spiked Granola Bar |
Mean value |
4.55 |
5.07 |
5.09 |
5.06 |
Fortified Hemp flower |
Mean value |
4.81 |
5.05 |
5.11 |
5.15 |
|
RSD (n = 3) |
13.53 |
1.61 |
1.58 |
1.15 |
RSD (n = 3) |
9.68 |
1.22 |
0.6 |
1.48 |
||
|
Recovery (%) |
91 |
99 |
102 |
101 |
Recovery (%) |
96 |
101 |
102 |
100 |
Recovery was calculated by subtracting measured concentrations from spiked concentrations. It can be seen that the majority of the analytes were not detected, while spike recoveries and relative standard deviation (RSD) of three replicates of five ppb spikes are all well within the validation protocols specified in the United States Pharmacopeia (USP) Compendial Chapter <233> of 70-150 percent recovery of the spike with an RSD of less than 15 percent.7
This investigation has shown that different types of cannabis and cannabis-infused products can be dissolved very efficiently in the same microwave digestion method without the need to batch similar sample types. In approximately one hour, a rack of 24 samples can be digested, cooled, made up to volume and presented to the ICP-MS instrument for analysis. In addition, by using an optimised sampling procedure, the sample throughput can be improved by a factor of two compared to using a conventional autosampler.
Below: Table 4 – Concentrations (ppb) of As, Cd, Hg and Pb in the MCT oil, ghee, hemp oil, beef jerky, peanut butter and CBD oil, together with % spike recoveries of 5 ppb (Note: n.d = not detected)
|
75As |
111Cd |
200Hg |
208Pb |
75As |
111Cd |
200Hg |
208Pb |
||||
|
MCT oil |
Mean value |
n.d. |
n.d. |
n.d. |
n.d. |
Beef Jerky |
Mean value |
n.d. |
0.0482 |
n.d. |
0.057 |
|
RSD (n = 3) |
— |
— |
— |
— |
RSD (n = 3) |
— |
0.77 |
— |
1.65 |
||
|
Spiked MCT Oil |
Mean value |
5.39 |
5.04 |
5.13 |
4.94 |
Spiked Beef Jerky |
Mean value |
4.81 |
5.07 |
5.06 |
5.22 |
|
RSD (n = 3) |
1.36 |
1.54 |
1.24 |
1.89 |
RSD (n = 3) |
7.54 |
1.17 |
1.25 |
1.86 |
||
|
Recovery (%) |
108 |
101 |
103 |
99 |
Recovery (%) |
96 |
100 |
101 |
103 |
||
|
Ghee |
Mean value |
n.d. |
n.d. |
n.d. |
n.d. |
Peanut Butter |
Mean value |
n.d. |
0.111 |
n.d. |
0.0511 |
|
RSD (n = 3) |
— |
— |
— |
— |
RSD (n = 3) |
— |
3.92 |
— |
1.32 |
||
|
Spiked Ghee |
Mean value |
5.46 |
5.05 |
5.15 |
5 |
Spiked Peanut Butter |
Mean value |
5.22 |
5.28 |
5.13 |
5.11 |
|
RSD (n = 3) |
3.8 |
2.01 |
1.19 |
1.73 |
RSD (n = 3) |
5.32 |
1.08 |
1.45 |
2.93 |
||
|
Recovery (%) |
109 |
101 |
103 |
100 |
Recovery (%) |
104 |
103 |
103 |
101 |
||
|
Hemp oil |
Mean value |
n.d. |
n.d. |
n.d. |
0.0723 |
Conc. CBD Oil |
Mean value |
n.d. |
n.d. |
n.d. |
0.0662 |
|
RSD (n = 3) |
— |
— |
— |
1.6 |
RSD (n = 3) |
— |
— |
— |
0.78 |
||
|
Fortified Hemp Oil |
Mean value |
5.27 |
5.18 |
5.2 |
5.09 |
Spiked Conc. CBD Oil |
Mean value |
5.41 |
5.17 |
4.93 |
5.05 |
|
RSD (n = 3) |
11.91 |
1.53 |
2.1 |
1.5 |
RSD (n = 3) |
10.43 |
0.7 |
2.03 |
2.74 |
||
|
Recovery (%) |
105 |
104 |
104 |
100 |
Recovery (%) |
108 |
103 |
99 |
100 |
References
- Marijuana Policy by State: https://www.mpp.org/states/
- Measuring Heavy Metal Contaminants in Cannabis and Hemp: A Practical Guide; R. J. Thomas, CRC Press, Boca Raton, FL, US, ISBN: 9780367417376, (Available September, 2020).
- United States Pharmacopeia General Chapter <232> Elemental Impurities – Limits: First Supplement to USP 40–NF 35, 2017, https://www.usp.org/chemical-medicines/elemental-impurities-updates
- ICH Q3D Step 5 Guidelines, ICH Website: http://www.ich.org/products/guidelines/quality/article/quality-guidelines.html (Q3D)
- California Bureau of Cannabis Control, Medical Cannabis Regulations, https://bcc.ca.gov/law_regs/cannabis_order_of_adoption.pdf
- Practical Guide to ICP-MS: A Tutorial for Beginners, CRC Press, Boca Raton, FL, US, ISBN: 978-1-4665-5543-3, 2014
- United States Pharmacopeia General Chapter <233> Elemental Impurities – Procedures: Second Supplement to USP 38–NF 33, 2015, https://www.usp.org/chemical-medicines/elemental-impurities-updates
About the authors
 Robert Thomas is the principal of Scientific Solutions, a consulting company that serves the training, application, marketing and writing needs of the trace element user community. He has worked in the field of atomic and mass spectroscopy for more than 45 years, including 25 years for a manufacturer of atomic spectroscopic instrumentation. He has also served on the American Chemical Society (ACS) Committee on Analytical Reagents (CAR) for the past 19 years as leader of the plasma spectrochemistry, heavy metals task force,
where he has worked very closely with the United States Pharmacopeia (USP) to align ACS heavy metal testing procedures with pharmaceutical guidelines. Robert has an advanced degree in analytical chemistry from the University of Wales, UK and is also a Fellow of the Royal Society of Chemistry (FRSC) and a Chartered Chemist (CChem).

Jon Peters has fifteen years of experience with marketing and analytical instrumentation and has worked extensively with ICP, ICPMS, AA, TOC and X-Ray analytical instrumentation.
 Bob Lockerman graduated from the University of New Hampshire with a Bachelor of Science degree in analytical chemistry. Upon graduation, he worked as a bench chemist for a commercial testing lab in Massachusetts. He was also part of the team that developed the world’s first microwave digestion system.
Related topics
CBD hemp & cannabis, Equipment, Fats & oils, Ingredients, Quality analysis & quality control (QA/QC), Rapid Detection, Regulation & Legislation, Research & development, Technology & Innovation
Related organisations
American Chemical Society (ACS), Committee on Analytical Reagents (CAR), Royal Society of Chemistry (FRSC), Scientific Solutions, United States Pharmacopeia (USP), University of New Hampshire