Shared experience on protein analysis in crops and derived protein extracts
- Like
- Digg
- Del
- Tumblr
- VKontakte
- Buffer
- Love This
- Odnoklassniki
- Meneame
- Blogger
- Amazon
- Yahoo Mail
- Gmail
- AOL
- Newsvine
- HackerNews
- Evernote
- MySpace
- Mail.ru
- Viadeo
- Line
- Comments
- Yummly
- SMS
- Viber
- Telegram
- Subscribe
- Skype
- Facebook Messenger
- Kakao
- LiveJournal
- Yammer
- Edgar
- Fintel
- Mix
- Instapaper
- Copy Link
Posted: 9 April 2020 | Paul Baker | No comments yet
Dr Paul Baker from Bangor University, Wales, outlines the work he and the research team have been undertaking to develop protein extraction techniques using agricultural crop waste.
As part of a European Union funded project, we have been working on developing protocols for extracting proteins from sources of the main agricultural crop wastes found in Europe, these are rapeseed, olives, tomatoes and citrus fruits.
The rapeseed and olive wastes occur during the extraction process. A considerable proportion of tomatoes and citrus fruits are also deemed unsuitable for sale or processing after harvesting, due to sizing issues or minor imperfections.
Two approaches have been used to quantify the protein content of various components within each of the crops, which are classed as flours (protein content >40 percent), concentrates or isolates, in order of increasing protein content.
Kjeldahl analysis, which is widely used in the food industry, is one of the methods. In this analysis, the nitrogen content is determined and multiplied by a correction factor of six to provide the protein content. Generally, Kjeldahl analysis provides a good indication of the protein content, although it can be time consuming for routine analysis of samples.
There are also some issues with this method. For example, anti-nutritional compounds such as glucosinolates that also contain nitrogen are present in higher amounts in rapeseed, meaning these compounds could potentially be co-extracted along with protein extracts. Therefore, it is important to evaluate the concentrations of glucosinolates in any protein extract derived from rapeseed.
Furthermore, the green pigment in many vegetables and leaves, chlorophyll, also contains nitrogen, which may affect the accuracy of the measured protein content in foods. According to the Encyclopaedia of Food and Health published in 2015, digestion of chlorophylls results in their conversion to pheophytins, within the acidic conditions of the gastric juices, but little is known about how chlorophylls are further metabolised.
An alternative method for protein analysis is the Bradford assay. The assay, which is easy to perform and requires Bradford reagent that can be readily purchased, is used regularly in our laboratory to determine protein contents of crop components and protein extracts. The Bradford reagent is in the cationic state when unbound and exhibits a red colouration, which switches to blue when in the anionic state and bound to protein. This causes a spectral shift from 465nm to 595nm. In the assay, the protein is diluted, the Bradford reagent is added and mixed, and protein determination achieved through the use of either a microplate reader or spectrophotometer at an absorbance value of 595nm and within 30 minutes of adding the reagent.
Insoluble proteins cannot be measured using the Bradford assay until they have first been hydrolysed under alkaline conditions. Components such as seeds require ball milling and then treatment with 0.2 M sodium hydroxide at 50°C, with constant mixing, and can still result in an underestimation of the protein content. The use of sodium hydroxide at these molarities did not appear to affect the protein standard curve using bovine serum albumin (BSA).
The effect of hydrolysis in a more concentrated alkaline medium, in order to fully digest the protein and obtain a more accurate determination of content has not been evaluated. In the standard assay, the protein is diluted until it falls within the linear range of 0 to 100µg BSA and then the concentrations are calculated after subtracting the measurements where no protein is present. It is necessary to know the total quantity of water in order to calculate the total amount of protein, which is then divided by the dry weight of biomass.
The dry weights in our laboratory have been determined using a moisture analyser at 105°C until water evaporation ceases. It is assumed that this temperature does not result in decomposition of the material being analysed, that could result in other volatile compounds being released.
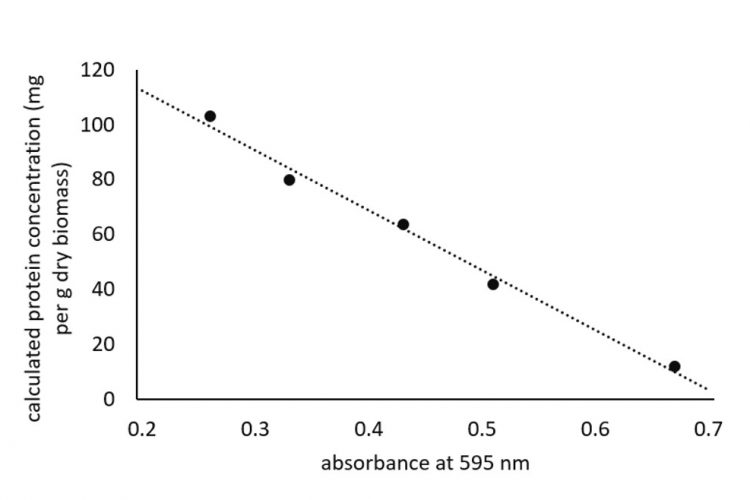
Figure 1: Relationship between increasing diluted samples giving lower absorbance values and measured protein concentration of cherry tomato seeds
In our assays, we have frequently found that the calculated concentration of the protein varies considerably even though it is within the linear range of the standard protein. Lower absorbance values were obtained as the protein samples were diluted, as would be expected. However, the calculated protein concentration that takes into account the dilution factor also showed a decline (Figure 1) and instead should have remained at the same value regardless of the measured absorbance value. Based on empirical data, it would appear the calculated protein concentrations showed a good correlation with the data obtained from Kjeldahl analysis, when protein samples were diluted to an absorbance value just above 0.4.
Understandably, the amino acid content and protein conformation of the unknown proteins will differ significantly from BSA, which in turn, will affect how the Bradford reagent will react with the proteins. Some hypothetical, standard curves for unknown proteins are highlighted (Figure 2).
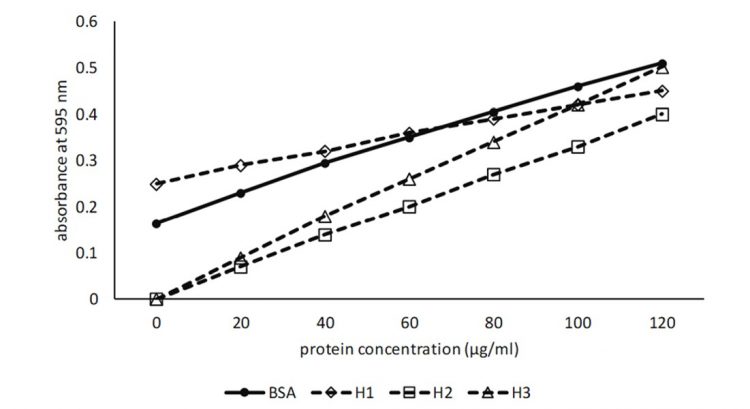
Figure 2: Standard curve for BSA based on actual data. H1-H3 hypothetical data indicating possible standard curve for an unknown protein
The standard curve H1 shows a crossover point about midway on the BSA standard curve and the calculated protein concentrations with high absorbance values will be underestimated, while low absorbance values will be overestimated. The most accurate results will be obtained when the absorbance values are measured midway on the BSA standard curve at 0.4.
The standard curve H2 shows that the standard curve converges with the BSA standard curve at the highest absorbance values. Consequently, calculated protein concentrations will become lower as the absorbance values decrease, while values measured midway on the BSA standard curve are more likely to reflect actual protein concentrations than lower absorbance values. Should the standard curves converge in the opposite direction, then the converse would be true.
The standard curve H3 is below and parallel with the BSA standard curve and it would be expected that protein concentrations would be underestimated. It is possible that the high molecular weight of proteins derived from seeds limits interaction with the Bradford reagent, leading to this type of standard curve. Therefore, it would appear that diluting the protein sample sufficiently, so that the absorbance value occurs midway on the BSA standard curve, will provide the best possible outcome for the accuracy of protein content determination.
About the author
Dr Paul Baker was trained in microbiology and obtained research experience in England, Denmark, Japan, USA and Ireland. He works at the BioComposites Centre at Bangor University, Wales on research projects that provide further insight for company research. He is currently involved in the ProEnrich project recovering proteins from major crop residues. These proteins are sent to Tate & Lyle, Mars and Chimar for further analysis.
Related topics
Fats & oils, Food Waste, Ingredients, New product development (NPD), Processing, Proteins & alternative proteins, Research & development, Technology & Innovation