Webinar Highlights: Introduction to instrumental food texture analysis
- Like
- Digg
- Del
- Tumblr
- VKontakte
- Buffer
- Love This
- Odnoklassniki
- Meneame
- Blogger
- Amazon
- Yahoo Mail
- Gmail
- AOL
- Newsvine
- HackerNews
- Evernote
- MySpace
- Mail.ru
- Viadeo
- Line
- Comments
- Yummly
- SMS
- Viber
- Telegram
- Subscribe
- Skype
- Facebook Messenger
- Kakao
- LiveJournal
- Yammer
- Edgar
- Fintel
- Mix
- Instapaper
- Copy Link
Posted: 18 May 2020 | AMETEK Brookfield | No comments yet
Ametek Brookfield’s Christopher Freeman recently led a webinar, hosted by New Food, on the application of instrumental texture analysis within the food industry. Here are the highlights.
As part of New Food’s Issue 2 2020, Ametek Brookfield reviewed the highlights from their recent New Food webinar:
The texture analyser imposes controlled mechanical conditions to a sample and quantifies the sample’s response to these imposed conditions. The response is directly related to the physical characteristics of the product being tested and provides real-life indicators of a product’s physical structure.
The texture analyser either operates in compression or tension modes where cyclic testing may be applied within each. The use of compression or tension forces enables the technologist to impose imitative conditions optimal for determining true real-life physical characteristics of the sample.
Instrumental texture analysis should serve as a complement to the sensory test panel and not a replacement. It is for this reason that correlation between texture measured by the senses and texture measured instrumentally has been thoroughly investigated.
When it comes to instrumental food texture analysis, the compression mode is most popular as these tests accurately simulate mastication. An array of textural parameters may be drawn from a food texture analysis study. These characteristics have been derived from various academic studies over the course of 50 years in which the science of texture analysis has been investigated.
The bulk of these parameters is correlated to sensorial characteristics, which have been identified as showing correlation between taste panel results and instrumental analysis.
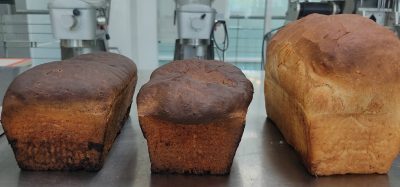
The Texture Profile Analysis test (TPA) is a two-cycle compression test that correlates well with sensory evaluation parameters such as hardness and springiness. The TPA test can be used to analyse most samples, including those in the dairy, bakery, gels, confectionery, meats, fruit and vegetable industries. TPA can also be used to quantify multiple textural parameters in just one test.
Application of Instrumental Texture Analysis Within The Food Industry
This webinar is available to watch on-demand at a time that suits you!
Texture analysis is an integral part of quality control (QC) evaluation, where the textural properties of foods are assessed sample-to-sample generating data paramount to the manufacturer and supplier. Therefore, both parties must be confident that the method followed is reliable, reproducible and accurate, and that the results generated have ‘real-life’ value or meaning.
The development and manufacture of both new and existing products incorporates the quantification of food texture through both sensorial and instrumental methods. It can quantify texture parameters and predict consumer responses, or evaluate QC tools or parameters.
Instrumental texture analysis should serve as a complement to the sensory test panel and not a replacement. It is for this reason that correlation between texture measured by the senses and texture measured instrumentally has been thoroughly investigated. The nature of foods, particularly those of ‘solid’ consistency, has meant that methods are predominantly empirical in nature, validating or quantifying subjective parameters such as fruit firmness as an indication of ripeness.
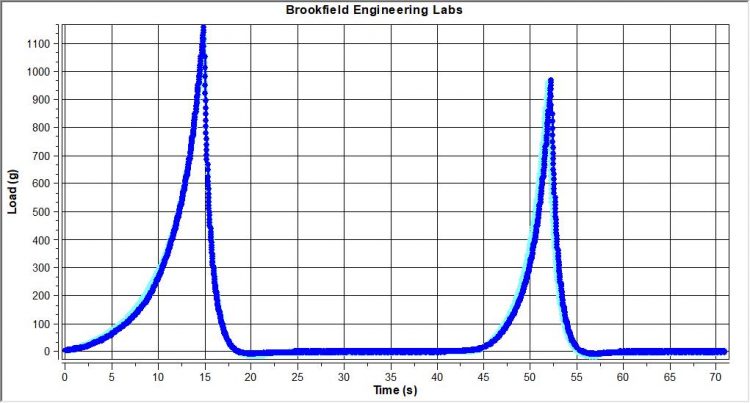
The TPA test was developed using uniaxial compression cycles to assess the mechanical properties of a sample. The test is designed to run two consecutive cycles from a single point of trigger at a constant speed, from which seven pre-defined sensorial parameters may be quantified, including hardness, cohesiveness, springiness, gumminess, resilience, fracturability and chewiness of a foodstuff.
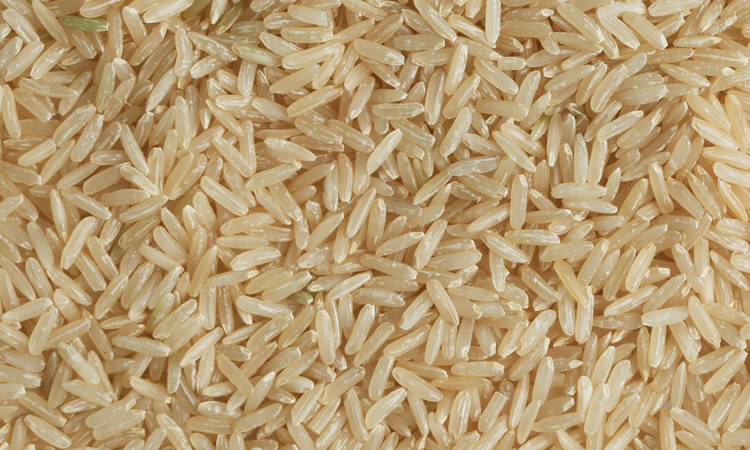
The two maximum force values on the graph (see Figure 1) are a measure of sample hardness in the first and second cycle. These values correlate with the amount of force required by the teeth to compress – in this instance, rice grains when chewing; the higher the value, the harder the grains.