

Hyperspectral chemical imaging maps food composition in laboratory and on-line
- Like
- Digg
- Del
- Tumblr
- VKontakte
- Buffer
- Love This
- Odnoklassniki
- Meneame
- Blogger
- Amazon
- Yahoo Mail
- Gmail
- AOL
- Newsvine
- HackerNews
- Evernote
- MySpace
- Mail.ru
- Viadeo
- Line
- Comments
- Yummly
- SMS
- Viber
- Telegram
- Subscribe
- Skype
- Facebook Messenger
- Kakao
- LiveJournal
- Yammer
- Edgar
- Fintel
- Mix
- Instapaper
- Copy Link
Posted: 10 September 2009 | T. Hyvärinen & H. Karjalainen, SPECIM, Spectral Iimaging Ltd; D. Nilsson, Umbio AB and K. Lynch, Gilden Photonics | 1 comment
Hyperspectral imaging combines digital imaging with precise spectral information in each image pixel. It enables composition mapping in food and agricultural raw materials and products based on differences in the spectral signatures of the various chemical ingredients. Advances in hyperspectral cameras and image processing solutions are now making hyperspectral imaging an efficient tool for high throughput laboratory analyses, and even making it possible to apply it on-line in quality assurance and process control applications.
Hyperspectral imaging combines digital imaging with precise spectral information in each image pixel. It enables composition mapping in food and agricultural raw materials and products based on differences in the spectral signatures of the various chemical ingredients. Advances in hyperspectral cameras and image processing solutions are now making hyperspectral imaging an efficient tool for high throughput laboratory analyses, and even making it possible to apply it on-line in quality assurance and process control applications.
Hyperspectral imaging combines digital imaging with precise spectral information in each image pixel. It enables composition mapping in food and agricultural raw materials and products based on differences in the spectral signatures of the various chemical ingredients. Advances in hyperspectral cameras and image processing solutions are now making hyperspectral imaging an efficient tool for high throughput laboratory analyses, and even making it possible to apply it on-line in quality assurance and process control applications. Near infrared (NIR, 700-2500 nanometres) spectral analysis is widely used in the agriculture and food industry, as well as in many other industries. Traditional NIR analysers measure bulk properties of samples taken for analysis, and raw materials and finished products moving on a conveyer belt. In several materials and products, their quality and functionality depend on either uniformity or certain specific heterogeneity (structure) in the composition. Thus, being able to assess the spatial distribution of the composition will provide very valuable additional information. NIR hyperspectral imaging makes it possible, both as a research tool during the development process of new products and as a quality assurance and process control tool in the manufacturing process. This article serves as an overview of how this new technology can efficiently solve chemical mapping problems both in the laboratory and on-line.
Hyperspectral imaging technologies
A hyperspectral image of a sample is collected in the form of a 3-dimensional data set (data cube), which has two spatial dimensions and a spectral dimension. There are two main approaches to collect the 3-dimensional data cube. They both require a 2-dimensional sensor array and, in front of it, a special optic to separate wavelengths from each other. One approach is usually called push-broom imaging and the second is referred to as staring imaging1-4. Their operating principles are illustrated in Figure 1. A push-broom imager consists of an imaging spectrograph in front of the 2-dimensional sensor array. A line of the target (sample) is imaged onto the rows of the sensor array (x dimension) at a time. The spectrograph generates a spectrum for each point in the line across the second dimension of the array (λ dimension). Therefore, full spectra are collected at exactly the same time. For imaging a sample, either the sample or the imager needs to move or be moved, and the hyperspectral image (data cube) is built line by line (in a spatial line scan mode).  In the second approach, an optical tuneable band-pass filter is integrated in front of the 2-dimensional sensor array. Thus, the staring imager acquires an area image (in x and y dimensions) at a single spectral waveband at a time. The spectral dimension of the data cube is collected by tuning the spectral waveband in time. Inherently, a push-broom imager is a natural choice for on-line and other applications where the target or imager itself is in movement. A tuneable filter imager seems an equally apparent choice for imaging stationary samples. The conclusion however is not so simple, because there are considerable differences in the optical characteristics in the technologies, significantly affecting their light collection efficiency and requirements for illumination. The most significant difference is in the light throughput from the sample onto the sensor array, which is typically 10 to 15 times higher in a push-broom hyperspectral camera than in a staring tuneable filter camera. In real applications, this means:
- That light intensity (and therefore heat load) on the sample can be 10 to 15 times lower in a push-broom camera system. Many food materials and products are sensitive to heat load and this significantly helps these samples to stay representative during the mapping
- Alternatively, under the same illumination conditions, a push-broom camera is able to collect the hyperspectral image 10 to 15 times faster, increasing the throughput of the mapping application
Secondly, a push-broom imager only needs a narrow line to be illuminated on the sample, which further reduces the overall heat load.
Instrumentation for hyperspectral imaging in laboratory and at-line
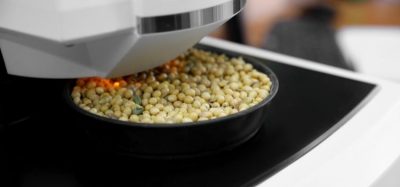
In order to apply push-broom hyperspectral imaging to map composition in a sample, the sample has to be moved with respect the hyperspectral camera. It is accomplished by using a simple linearly scanning sample stage beneath a downward looking hyperspectral camera and line illumination set-up, as shown in the instrument in Figure 2. The instrument is a hyperspectral chemical imaging workstation, SisuCHEMA, from SPECIM, Spectral Imaging Ltd (Oulu, Finland). For sample presentation, the sample tray comes out for sample placement. After the sample is placed on the tray, and the scan is initiated from the instrument computer, imaging the sample takes place fully automatically, and the tray slides back for sample removal.  The hyperspectral camera employs SPECIM’s MCT camera and ImSpector N25E imaging spectrograph, which cover the spectral range of 970 to 2500 nanometres, with spectral sampling of 6.3 nanometres. The MCT sensor has 320 (spatial) x 256 (spectral) pixels, and acquires up to 100 images per second. The camera can be equipped with various fore lenses for various fields of view (FOV). The width of the viewing area is defined by the lens FOV and working distance of the camera, which is adjustable. Here the range of the viewing area is from 9.6 millimetres to ca. 200 millimetres, and with 320 pixels, the imaging resolution ranges from 30 microns to 0.63 millimetres, respectively. The length of the image only depends on the length of the moving stage, and thus relatively long samples can be imaged. The sample scan speed depends on the required spatial resolution (pixel size on sample) and the image rate. Scan speed v = p r, where p is the required spatial resolution on the sample and r is image rate from the camera. As an example, imaging at high spatial resolution of 30 μm and with the hyperspectral camera running at 100 images/s, the scan speed is 3 mm/s. A 10 millimetre long sample is imaged in just 3.3 seconds, and 10 of the samples in a row would be scanned in 33 seconds. In terms of spectra, this corresponds to collecting 32,000 full NIR spectra per second.
Hyperspectral image processing
Processing of the hyperspectral image will depend on the application purposes, but the same spectral analyses (chemometric) methods can be used as with NIR bulk analyses. Now they are applied to the spectra in each image pixel. For the creation of a quantitative composition mapping application, first a set of samples with known characteristics is imaged. Usually it requires that the calibration samples are characterised by using well established laboratory techniques. The range of variation in the calibration samples needs to be representative to that in the actual application samples to be mapped. A calibration/prediction model is created by analysing the correlation between the spectral data and the data from the laboratory characterisations. Application of Principal Component Analysis (PCA) or Spectral Angle Mapping (SAM) with Partial Least Squares (PLS) regression is a typical chemometric approach for building the calibration/prediction model. Another approach for quantitative composition assessment is Science Based Calibration (SBC). It is based on the known spectra of the pure components in the composition. Thus, it requires a minimal amount of experimental work with calibration samples. This method works very well when the pure components of the material or product are available, as typically is the case with pharmaceutical products. The method might be applicable to several agri-food applications, too. Very few chemometric software tools are commercially available which support the analysis of spectral image data. Evince Image software from Umbio AB (Umeå, Sweden) was used to process the image data collected with the SisuCHEMA instrument. Evince Image is specifically developed for visualisation and processing of hyperspectral image data and building prediction models for routine chemical imaging applications. The software includes standard spectral pre-processing tools (like derivatives, multiple scatter correction), data compression tools (like PCA, SAM) and regression tools, as well as a very versatile graphical user interface.
Assessing quality in cottage cheese
NIR hyperspectral imaging was used to assess the quality in cottage cheese. It is a granular cheese with a grain size of approximately five millimetres. A range of cheese samples of varying quality were imaged, and then analysed in the laboratory for solid content, moisture and protein. They are the main chemical quality attributes and influence sensory characteristics, particularly hardness of the grains. PCA was applied to generate a classification model to distinguish samples which differ in these three quality factors. As a first step, the first principal component of the image was used to remove the background (sample tray surface) from the cheese grains. With the background removed, the internal variations in the samples became more apparent. Figure 3 (page 56) shows a classification example in five sample sets. The PCA score plot on the right in Figure 3 shows two clusters of image pixels which represent the two main qualities of the grains. In the pseudo-colour visualisation from the first three principal components of the sample sets, the greenish granules are low in solid content and have high moisture and low protein content. The reddish granules have higher solid content and are rich in protein.  The sample sets were imaged with spatial resolution of 0.15 millimetres and each data cube included ca .320×390 = 124,800 spatial pixels with full spectra in 970 to 2500 nanometres. The data cube was collected in just 3.9 seconds. Once the calibration model is developed and evaluated, it can be applied in various image scales. Figure 4 shows an image of a single cut cheese grain, which was canned with 30 micron pixel resolution. The image reveals higher solid and protein content in the peripheral and higher moisture in the central region.
Taking hyperspectral imaging to real-time on-line applications
Another advantage that push-broom hyperspectral imaging provides is that the same hyperspectral camera and illumination technology and image prediction methodology developed for analysing samples in laboratory, can be directly transferred to on-line applications. There the samples are in continuous movement under the push-broom camera and illumination unit, which are installed (in a proper enclosure) on the production line. As a first step towards on-line quality and process control, a high throughput hyperspectral scanner instrument, as described previously, can be installed near a production line. Sampling from the production could be arranged manually, or though an automated sampler, when it could feed samples through the hyperspectral scanner in a continuous flow. It could dramatically increase the number of samples analysed, compared to an approach where samples are taken to an analysis laboratory for characterisation. A hyperspectral camera produces a large amount of data and its processing in real-time has been a bottleneck for 100 per cent on-line mapping solutions. Advancements, on one hand in smart hyperspectral cameras and in standard multiple core computers on the other hand, are making it possible to integrate real-time hyperspectral imaging systems using off the shelf components. New smart hyperspectral cameras can be easily programmed to produce only the spectral data relevant for a specific application, and output it at very high speed (hundreds and even 1000 images/s). Standard Windows based computers make the system flexible to program and configure for a new application. The prediction model created by using the SisuCHEMA scanner and Evince Image software is transferred to the Evince Online Server for running the model in real time. The Hyperspectral NIR camera, which is installed on the process line together with an illumination unit, feeds the image data directly to the server. The server predicts the image data line by line, and outputs the results to an operator station for visualisation and/or through an RS-line to a programmable logic unit for quality/process control actions. A typical data processing work-flow in the on-line system is shown in Figure 5.  NIR hyperspectral imaging combines two traditional techniques, NIR spectral analysis and digital image analysis. In addition to a very powerful chemical imaging tool in R&D laboratories, hyperspectral imaging and processing technology is maturing for real-time quality and process control.
References
- B. Agar and D. Coulter, “Remote Sensing for Mineral Exploration – A Decade Perspective 1997-2007”, in Proceedings of Exploration 07: Fifth Decennial International Conference on Mineral Exploration, Ed by B. Milkereit. P. 109-136 (2007).
- Y. Garini, I.T. Yang and G. McNamara, Spectral Imaging: Principles and Applications. International Society for Analytical Cytology. Cytometry Part A 69A:735-747 (2006).
- W.D. Schmidt, F. Erfurth, B. Nyuyki and D. Fassler, “Fluorescence Imaging Spectroscopy of Biochips” in 2nd International Spectral Imaging Workshop, Hyperspectral Data for New Vision Applications, Ed by R. Leitner. Oesterreichische Computer Gesellschaft Komitee für Öffentlichkeitsarbeit, Villach, p. 27-34 (2005).
- N. Gat, “Imaging Spectroscopy Using Tunable Filters: A Review” in Wavelet Applications VII: Proceedings SPIE Vol. 4056, p. 50-64 (2000).


A very informative paper. Would it be possible to ge a pdf of the same?