Behind the scenes of dietary fibre labelling
- Like
- Digg
- Del
- Tumblr
- VKontakte
- Buffer
- Love This
- Odnoklassniki
- Meneame
- Blogger
- Amazon
- Yahoo Mail
- Gmail
- AOL
- Newsvine
- HackerNews
- Evernote
- MySpace
- Mail.ru
- Viadeo
- Line
- Comments
- Yummly
- SMS
- Viber
- Telegram
- Subscribe
- Skype
- Facebook Messenger
- Kakao
- LiveJournal
- Yammer
- Edgar
- Fintel
- Mix
- Instapaper
- Copy Link
Posted: 20 June 2016 | Muriel Henrion, Research Scientist / Frédéric Robin, Project Manager / Emilie Labat, Purchasing Specification Manager / Enrico Chavez, Senior Statistician - all from Nestlé’s Product Technology Center, Orbe, Switzerland | No comments yet
Consumer interest for dietary fibre has markedly grown these past years as a number of studies now link increased fibre intake to reduced risks of cancer and cardiovascular diseases, digestive health benefits, and weight management. To meet these expectations, product development has drastically expanded in the last five years, enabling consumers to find dietary fibres in all product categories. However, behind the mere labelling of dietary fibre content in a beverage or an instant porridge lies an intricate regulatory and analytical system. The sole definition of dietary fibre is still disputed: a dozen AOAC analytical methodologies exist; nutritional (content) and health claims require strictly defined dietary fibre amounts; and tolerance levels vary greatly. As their measurement is complex, dietary fibres are often not mentioned in raw material specifications. The purpose of this article is to unravel some of the complexity behind dietary fibre labelling.
Communicating fibre benefits in a challenging regulatory environment
Based on the definition of the European Food Safety Agency (EFSA), dietary fibre (DF) includes non-starch polysaccharides, resistant starch, resistant oligosaccharides with three or more monomeric units and other non-digestible, but quantitatively minor, components that are associated with the dietary fibre polysaccharides, especially lignin1. This definition is in accordance with Codex Alimentarius’ (CODEX) definition, although the inclusion of non-digestible carbohydrates with 3-9 monomeric residues is so far left of the national authorities2. Examples of DF include cellulose, hemicelluloses, pectins, hydrocolloids, fructo-oligosaccharides (FOS), galacto-oligosaccharides (GOS) or resistant starch.
Communicating the nutritional and health benefits of DF on food packs is strongly regulated. Two content claims are allowed by the European Community (EC)3 and CODEX4 . A ‘source of fibre’ claim is reached from 3g of DF per 100g or from 1.5g per 100kcal in EC. According to CODEX, this claim may also be granted if DF brings at least 10% of the daily recommended value (DRV) per serving. From 6g of DF per 100g or 3g per 100kcal, ‘high in fibre’ can be communicated in EC (or if DF content is providing at least 20% of the DRV per serving, according to CODEX). Health claims associated to DF are even more strictly regulated. Only claims on specific types of DF are allowed and, most of the time, for foods high in that fibre5. Examples of heath claims include “contributes to an increase in fecal bulk” for oat grain DF or, “contributes to an acceleration of intestinal transit” for wheat bran DF.
Delivering the exact quantity of DF displayed on the nutritional labelling, in each and every product batch, is not feasible and most countries allow tolerances around the declared values. Compliance with the lower (LTL) and upper (UTL) tolerance levels must then be met considering all sources of variation (i.e. raw materials, manufacturing process and measurement uncertainty) (see Figure 1, below). Many countries set a single tolerance range to DF while others may define it according to several criteria. In the EC, the tolerance window depends upon: i) whether DF benefits are claimed; ii) the content of DF and iii) whether the declared value (D) is the same as the minimum specified in the conditions of use for the claim (EC, 2012). For instance, when DF content is comprised of between 10-40g per 100g of product and their content is claimed on the pack, tolerances may vary from +/- 20% of the D value (if the D value is way above the minimum value for claim) up to +40% of the D value (if the D value is the same as the minimum value for claim). In the first scenario, the measurement uncertainty must be included within the tolerance range, while in the second scenario it is excluded on the LTL, increasing the tolerance window further. The tolerances may be stricter when the D value is close to the minimum value for claim (+40% from the minimum value for claim, independently of the D value).
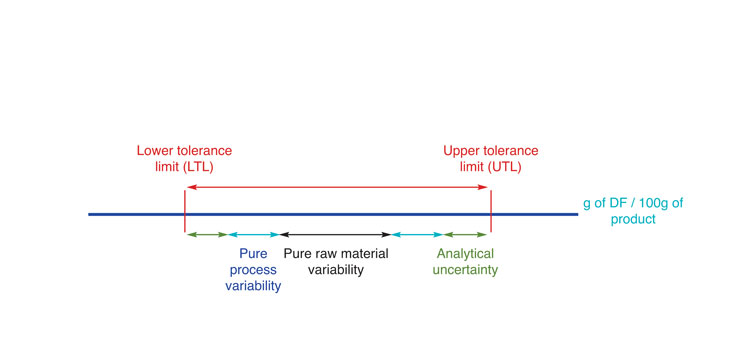
Figure 1: Sources of variation potentially impacting compliance in DF content
Addressing dietary fibre variability from crop to label
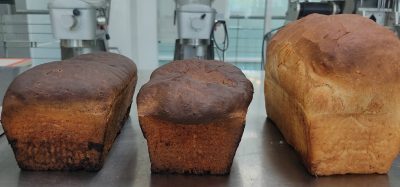
Cereals are a good source of DF and, being largely consumed worldwide, represent a large portion of the DF intake in the Western diet. However, as with any biological raw material, their DF content is greatly impacted by climate, growing conditions and cultivars. This was well illustrated during the HEALTHGRAIN initiative, which allowed reporting as much as 11% difference in total DF content between wheat cultivars and about 6% within the same cultivars6. Typical natural variation in oat flour β-glucan content is illustrated in Figure 2 (below). Such variability not only applies to plant raw materials, but also to processed DF, as either the extraction procedures or the physico-chemical reactions involved, for example in the manufacture of resistant dextrins, will themselves lead to more controlled yet still variable yields.
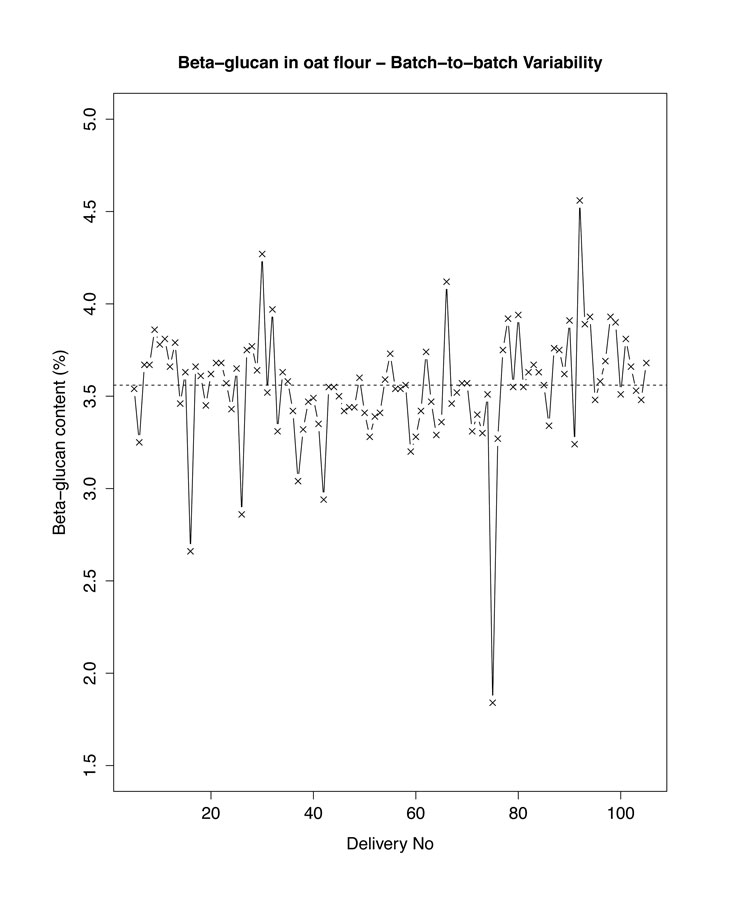
Figure 2: An example of natural variability in DF content: β-glucan content in oat flour
DF may be sensitive to processing, high shearing technologies (such as extrusion) leading, for example, to size reduction, or low pH (as in some beverages) to oxidative cleavage7. The impact of processing may vary greatly depending on the technology set-up (e.g. temperature and/or pressure profile) but also the type of DF involved. For instance, studies revealed that extrusion led to a much greater impact on structure and derived physico-chemical properties of citrus fibres – a highly soluble DF of medium-small size8– than on those of corn bran, an intricate insoluble DF matrix9. Extrusion of oat bran – a mixture of high molecular weight soluble DF (β-glucans) and of insoluble DF (mostly cellulose and xylans) – shows somewhat intermediate effects, increasing soluble DF content through opening of the cell wall matrix and liberation of some β-glucans chains, but also to depolymerisation of these polysaccharides10. This will impact the resulting viscosity generated by β-glucans in the finished products but also potentially compromise the use of the health claim associated with oat β-glucans and cholesterol lowering. Aside from health claims, any process leading to large depolymerisation of DF can impede content claims, depending on whether or not the local authorities encompass low molecular weight DF of DP 3-9 in their definition. When working with cereals as raw materials, this may occur through the action of native endogenous enzymes, provided that the processing conditions facilitate their activity, as in bread making11.
Lastly, the methodology applied in order to quantify DF for claim and labelling purposes may greatly impact effective quantification. If this aspect is obvious when dealing with low molecular weight soluble DF and non-inclusive methodologies (as the 985.29 or the 991.43), it may be more subtle when dealing with complex matrices containing mixtures of DF, process-depolymerised material, or resistant starches. Applying all inclusive methodologies as the 2009.01 is not always the best choice as it can lead to overestimation of the DF content.
Ensuring adequate supply through the raw material purchasing specification
Raw materials play a key role in ensuring finished product quality, i.e. desired performance, but also compliance, including safety and regulatory limits. Selecting the right raw material is one of the foundations of the food industry. Hence, establishing the parameter limits in raw material purchasing specifications is essential to ensure adequate purchase and prevent any deviation in the finished product quality. Moreover, when it comes to content or health claims, for instance ‘source of fibre’, quantitative and qualitative parameters defined in the specification must be highly reliable and defined by a cross functional team i.e. Quality Specialist, Regulatory and Scientific Affairs, manufacturing, Ingredient Expert and procurement.
Several options are possible to produce a DF rich food. One of them consists of using raw materials that are naturally rich in DF (i.e. whole grain cereals). An alternative would be to use processed DF ingredients (i.e. purified oat bran or resistant dextrins) or a combination of both. In the first case, considering the natural high variability in agricultural raw material composition previously described, it is common to set up purchasing specification limits based on global databases such as the U.S. Department of Agriculture (USDA) database, or to use other sources of historical data. The purchasing specification is then used to assess and ensure supply based on the defined parameters or needs. For commercially processed DF, variability in DF content is supposed to be well controlled by the supplier. In this case, the limit in the purchasing specification will thus be determined by using supplier data on recently produced batches. These should include variability from DF production, but also variability from the analytical measurement used to determine the DF content. In addition, the technical specification is also used to determine the lowest DF value. Furthermore, although DF content may be more or less controlled, DF quality (i.e. functionality) may, however, be impacted by processing, as previously mentioned. This is primarily the case when considering the molecular weight of DF and the subsequent viscosity or water-holding capacity they will generate. In such cases specific control points might be added to the raw material specification. These aspects, however, need to be discussed and negotiated with the DF supplier to find a compromise between the resulting heavier analytical assessment of the ingredient concerned and its supply and cost.
Finally, the ultimate gate keeper in compliance is certainly the release of the raw material at delivery. As far as regulatory related requirements (or claims) are concerned, raw material that would show any deviation in terms of DF content compared to that of the limit set in the specification, will be rejected.
Mastering variability through quality by design approach
When it comes to fulfilling a claim – for example, total β-glucan content for cholesterol lowering – compliant delivery must be achieved for each serving, whatever the level of variability tied to the ingredient. This is even more crucial when physiological tolerance issues are observed with said ingredient beyond a certain threshold. Such success may be achieved using compliance by design (CbD) approaches. One way of performing CbD is to apply statistical simulation techniques (i.e. Monte-Carlo): in the present case, simulate numerically the DF content, taking into account all sources of variability aforementioned (i.e. raw material, process itself, and the analytical method used to quantify the DF fraction – see Figure 3, below).
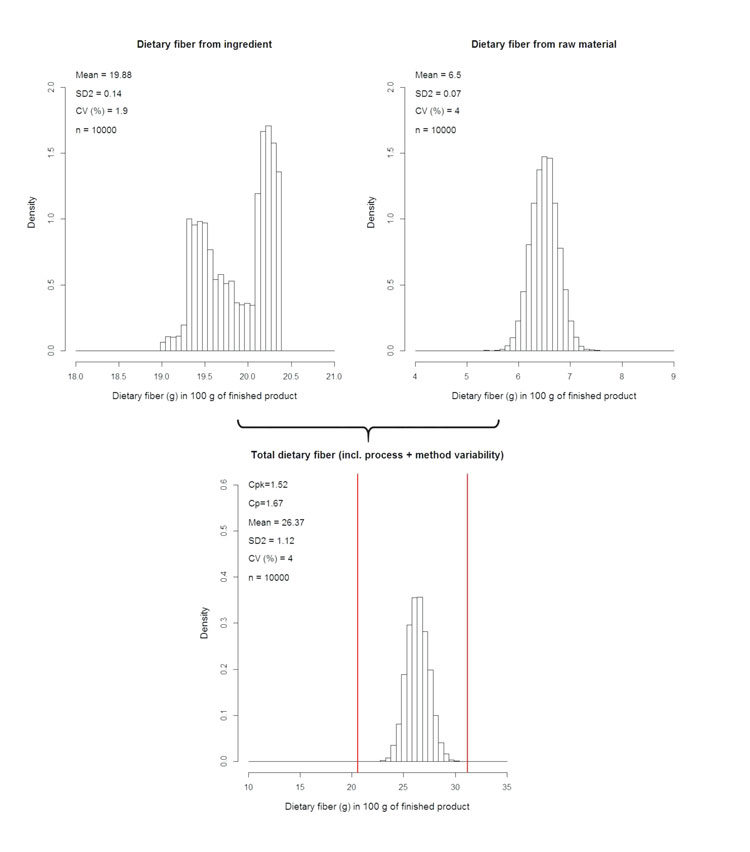
Figure 3: Numerical simulation of DF content in finished product using raw material and ingredient variability
This point is actually what all the preliminary work is about, i.e. to i) address the local regulatory context; ii) define the specification contents and limits; iii) evaluate the process impact and iv) select the appropriate analytical method. Indeed, regulatory assessment will enable setting upper and lower specification limits, hence the allowed delivery frame. Appropriate specification set-up will provide necessary information on the raw material variability window (raw material Coefficient of Variation or CV). Also, the proper study of the process impact will reveal if the DF is depolymerised and, if so, to what extent. With this knowledge, the adequate analytical methodology can be selected and thus the analytical variability (analytical CV) can be determined. Finally, processing itself must be under control, as determined through process capability studies. These will eventually provide the process CV, which will be the last entry to the simulation model.
Once simulations are executed, several corrective loops will likely have to take place to ensure the final DF delivery at target. These might require reformulation of the finished product, adaptation of the specifications for the DF ingredient, or even refining the process parameters to ensure compliance.
Some final considerations, to add complexity to an already delicate balance, are that more than one ingredient may be a source of DF in the finished product; raw material variability may not be known; and/or authorities may be using a different analytical method than the one assessed. Furthermore, labelling consistency will have to be monitored over time, to ensure that no deviation to target occurs. In a nutshell, journey to compliance is a continuous one.
References
- European Food Safety Agency (2010). Scientific Opinion on Dietary Reference Values for carbohydrates and dietary fibre. EFSA Journal, 8(3):1462
- Codex Alimentarius. (2009). Report of the 31st Session of the Codex Committee on Nutrition and Foods for Special Dietary Uses, Düsseldorf, Germany, 2–6 November, 2009.ALINORM 10/33/26
- European Community (2006). Regulation (European Community) No 1924/2006 of the European parliament and of the council of 20 December 2006 on nutrition and health claims made on foods. Official Journal of the European Union, L 404
- Codex Alimentarius (1997). Guidelines for Use of Nutrition and Health Claims. CAC/GL 23-1997
- European Community (2012). Commission Regulation (EU) No 432/2012 of 16 May 2012 establishing a list of permitted health claims made on foods, other than those referring to the reduction of disease risk and to children’s development and health. European Community. (2006). Official Journal of the European Union, L 136/1
- Gebruers K, Dornez E, Boros D, Fras A, Dynkowska W, Bedo Z, Rakszegi M, Delcour J A, Courtin C (2008). Variation in the content of dietary fibre and components thereof in wheats in the HEALTHGRAIN diversity screen. Journal of Agricultural and Food Chemistry, 56, 9740-9749
- Kivelä R, Nyström R, Salovaara H and Sontag-Strohm T (2009). Role of oxidative cleavage and acid hydrolysis of oat β-glucan in modelled beverage conditions, Journal of Cereal Science, 190-197
- Redwell R, Curti D, Robin F, Donato L and Pineau N (2011). Extrusion-induced changes to the chemical profile and viscosity generating properties of citrus fibre, Journal of Agricultural and Food Chemistry, 59, 8272-8279
- Ning L, Villota R and Artz W.E. (1991). Modification of corn fibre through chemical treatments in combination with twin-screw extrusion, Cereal Chemistry, 68, 632-636
- Zhang M, Bai X and Zhang Z (2011). Extrusion process improves the functionality of soluble dietary fibre in oat bran, Journal of Cereal Science, 54, 98-103
- Andersson A A, Rüegg N and Åman P (2008). Molecular weight distribution and content of water-extractable β-glucan in rye crisp bread, Journal of Cereal Science, 47, 399-406
About the authors
Muriel Henrion works as Research Scientist at Nestlé’s Product Technology Center in Orbe, Switzerland. She has eight years of experience in providing scientific support for the development of new products and technologies, with a focus on dietary fibres and whole grain cereals. She is further extending her support to process capability, by developing as a data scientist.
Frédéric Robin works as PMP-certified Project Manager at Nestlé’s Product Technology Center in Orbe, Switzerland. He has over 11 years of experience in leading innovation projects from research to industrialisation. He is the author and co-author of patents, scientific articles and book chapters on processing of nutritious ingredients and products.
Emilie Labat works as Purchasing Specification Manager at Nestlé’s Product Technology Center in Orbe, Switzerland. She has several years of experience in Research & Development as a cereal scientist supporting innovation and renovation in various product categories. She has further developed ingredient expertise in the field of cereals, whole grains and fibres.
Enrico Chavez works as Senior Statistician at Nestlé’s Product Technology Center in Orbe, Switzerland. He has over 15 years of experience in the pharmaceutical and food industry as a statistician providing support in R&D, Quality Assurance, and Manufacturing Operations.