Protein-polyphenol interactions
- Like
- Digg
- Del
- Tumblr
- VKontakte
- Buffer
- Love This
- Odnoklassniki
- Meneame
- Blogger
- Amazon
- Yahoo Mail
- Gmail
- AOL
- Newsvine
- HackerNews
- Evernote
- MySpace
- Mail.ru
- Viadeo
- Line
- Comments
- Yummly
- SMS
- Viber
- Telegram
- Subscribe
- Skype
- Facebook Messenger
- Kakao
- LiveJournal
- Yammer
- Edgar
- Fintel
- Mix
- Instapaper
- Copy Link
Posted: 11 August 2006 | Richard Frazier, Lecturer, School of Food Biosciences, University of Reading and Rebecca Green, Lecturer, School of Pharmacy, University of Reading | No comments yet
Evidence has been reported that dietary consumption of plants and plant products that are rich in tannins, such as cocoa, wine, tea and berries, can be related to protective effects against cardiovascular disease and certain forms of cancer.
These protective effects are assumed to stem from the antioxidant activity of tannins and their ability to act as free radical scavengers; free radicals being known to have damaging effects on cells and DNA in vivo. Polyphenols also possess a significant binding affinity for proteins, which can lead to the formation of soluble and/or insoluble complexes.
Evidence has been reported that dietary consumption of plants and plant products that are rich in tannins, such as cocoa, wine, tea and berries, can be related to protective effects against cardiovascular disease and certain forms of cancer. These protective effects are assumed to stem from the antioxidant activity of tannins and their ability to act as free radical scavengers; free radicals being known to have damaging effects on cells and DNA in vivo. Polyphenols also possess a significant binding affinity for proteins, which can lead to the formation of soluble and/or insoluble complexes.
Evidence has been reported that dietary consumption of plants and plant products that are rich in tannins, such as cocoa, wine, tea and berries, can be related to protective effects against cardiovascular disease and certain forms of cancer.
These protective effects are assumed to stem from the antioxidant activity of tannins and their ability to act as free radical scavengers; free radicals being known to have damaging effects on cells and DNA in vivo. Polyphenols also possess a significant binding affinity for proteins, which can lead to the formation of soluble and/or insoluble complexes.
It is uncertain how the protein-polyphenol interaction influences nutritional functionality, particularly in terms of bioavailability. Polyphenols are also thought to interact irreversibly with dietary proteins and digestive enzymes in the gut, and are believed to be transported bound to plasma proteins in vivo. Such protein binding may influence the physiological effects of polyphenols, depending upon their intake and structure. This article discusses our published work on the development of suitable methodologies to investigate the physical chemistry of protein-polyphenol interactions. The interaction of epicatechin with bovine serum albumin (BSA) is used as an illustrative example and we focus on the techniques of capillary electrophoresis (CE) and isothermal titration calorimetry (ITC).
Capillary electrophoresis
CE is widely known as a technique for analytical separations, but perhaps less known for its applicability to the determination of equilibrium binding (association/dissociation) constants for the formation of protein-ligand complexes. Essentially, CE can measure complex formation through the effects on electrophoretic mobility, which depends on molecular size-to-charge ratio. Many of the approaches to using CE for protein-ligand studies are based on adaptations of liquid chromatography methods, with the important advantage in CE that it does not rely on mass transfer between mobile and stationary phases.
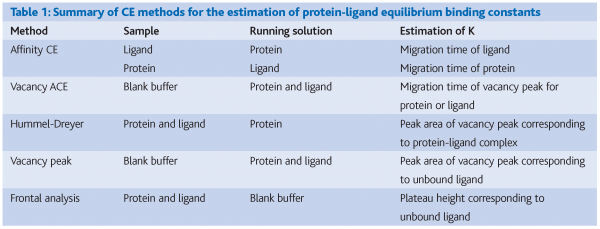
There are several methods for performing CE analysis of protein-ligand interactions in solution as summarised in Table 1. In all, data are collected in the form of an electropherogram (a plot of detector response vs. migration time). Interactions that change the molecular size, shape and/or charge of the protein or ligand can be detected and quantified through changes in migration time. Alternatively, peak areas of a complex or free ligand can be determined quantitatively.
We have evaluated several CE methods for the quantification of the interaction between epicatechin and BSA. In terms of reproducibility and robustness we have found that the frontal analysis method offers the most suitable approach for the study of protein-polyphenol interactions.
Frontal analysis capillary electrophoresis
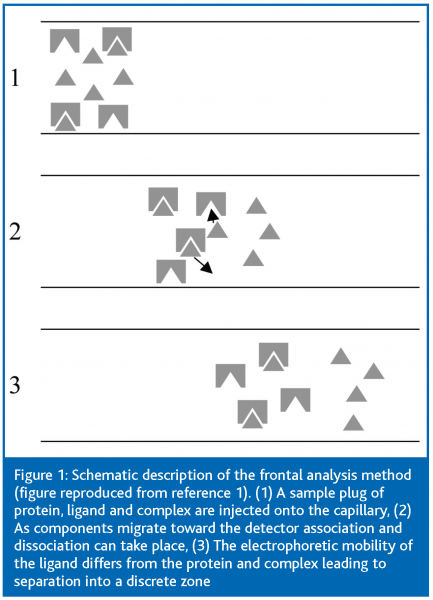
Figure 1 describes schematically the frontal analysis method. In the frontal analysis method the capillary is filled with buffer and a large sample plug is injected that consists of protein and ligand in equilibrium; therefore, the sample plug will contain unbound protein, free ligand and any complex that is formed between the two. It is assumed that the protein and the complex have approximately the same mobility, while the mobility of the free ligand must differ significantly from the mobility of the complex to enable the utilisation of the method. Two peaks are observed in the electropherogram corresponding to the protein/complex and to the free ligand, and the free ligand concentration is determined from its peak height. From the known total ligand concentration and the measured free ligand concentration, the association parameters (K, n) can be calculated. Briefly, the fraction r of bound ligand molecules per protein molecule is expressed as:


where [Lf], [Lb] and [Ptotal] are the concentrations of the free ligand, the bound ligand and the total protein, ni is the number of binding sites of class i and Ki is the corresponding association constant. Therefore, by plotting r against [Lf] non-linear regression analysis can be applied to yield values for K and n.
Experimental method and results
A Hewlett-Packard HP3D CE instrument (Agilent Technologies, Waldbronn, Germany) equipped with a diode-array detector and uncoated fused-silica capillaries (48.5 cm total length x 50 µm internal diameter) were used. Capillaries were rinsed and conditioned prior to each experiment with successive washes of sodium dodecyl sulphate, hydrochloric acid, sodium hydroxide and run buffer to ensure reproducibility and to remove any protein that may have adsorbed to the capillary wall. Samples containing fixed BSA concentration (0.25 mM) and varying epicatechin concentration (0.25 to 5 mM) in the appropriate buffer were pressure injected (50 mbar for 20 s) into the capillary and then a 10 kV voltage was applied across the capillary to achieve separation.
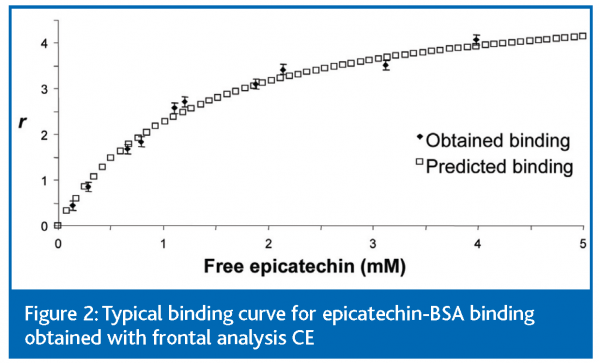
Experimental binding curves for the epicatechin-BSA interaction were constructed for each pH by plotting r against the molar concentration of free epicatechin, [ECfree]. Non-linear regression analysis was performed to find the theoretical fit to these data based on fitting the data to equation 2 using Microcal™ Origin™ software (version 5.0, Microcal Software, Inc., Northampton, MA, USA). Equation 2, given below, assumes one class of identical binding sites on BSA.


Figure 2 shows the data from a typical experiment and the accompanying theoretical fit. From such fitted data it was possible to derive typical values for the equilibrium constant, K, in the range of 400 – 1000 M-1 and for n in the range of 3.3 – 6.0 binding sites. Values of K and n were not significantly influenced by pH in the range pH 5.0 to 7.4. Further discussion of the data from frontal analysis CE is given in reference 1.
Isothermal titration calorimetry
ITC sensitively measures changes in enthalpy during a titration experiment in which ligand is added to a protein solution in a calorimeter cell held under isothermal conditions. It is a universal technique since enthalpy changes will occur during any interaction that leads to the formation of a complex. From a single experiment ITC allows the determination of association constant (K), stoichiometry (n), free energy (ΔG), enthalpy (ΔH) and entropy (ΔS) of binding, and therefore provides a wealth of important data, even for low affinity interactions. Principal advantages of ITC are that it can be used to characterise interactions in solution and without chemical modification or immobilisation of either interacting species. ITC can also be applied to systems where the complex formed is insoluble, as is often the case for protein-polyphenol systems. This is a distinct advantage over many solution based techniques, including CE, where complex insolubility can be problematic.
Experimental details
A CSC Nano ITC Series III (Calorimetry Sciences Corp., Lindon, UT, USA) was used in these experiments. In a typical experiment, BSA solution (0.2 mM) was placed in the sample cell of the calorimeter and epicatechin solution (10 mM) was loaded into the injection syringe. These concentrations were chosen to obtain a complete binding isotherm, which requires the concentration in the injection syringe to be approximately 10 times the concentration of binding sites in the cell, which were estimated from frontal analysis CE data. Epicatechin was titrated into the sample cell as a sequence of 20 injections of 10 ml aliquots with a time delay (to allow equilibration) between successive injections of 3 min. The contents of the sample cell were stirred throughout the experiment at 100 rpm to ensure thorough mixing. Raw data were obtained as a plot of heat (μJ) against injection number.
Control experiments included the titration of 10 mM epicatechin into buffer, buffer into BSA and buffer into buffer; controls were repeated for each buffer system used and at each BSA concentration. Control data were subtracted from experimental data prior to analysis.
Data analysis
ITC data were analysed using the BindWorksTM (Version 3.1.3, Applied Thermodynamics, Hunt Valley, MD, USA) ITC data analysis program. Data fits were obtained using an independent binding model for which the analytical solution for the total heat measured (Q) is determined by use of equation 3:


where V is the volume of the calorimeter cell, ΔH is enthalpy, [L] is ligand concentration, [M] is macromolecule concentration, n is the molar ratio of interacting species and K is the equilibrium binding constant. Free energy, ΔG, was determined from the binding constant (ΔG = –RT.lnK, where R is the gas constant and T is the absolute temperature in Kelvin) and Entropy, ΔS, from the Second Law of Thermodynamics (ΔG = ΔH – T.ΔS).
Results
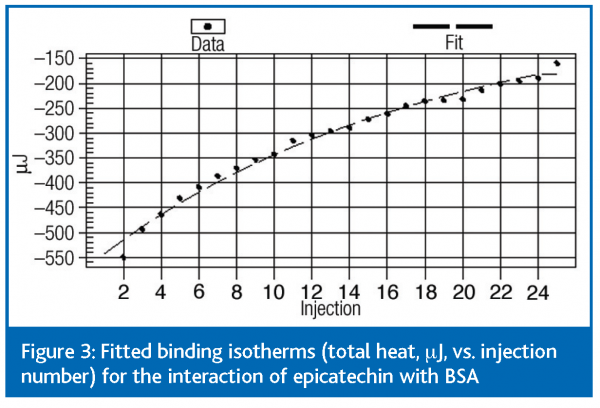
Fitted data at pH 7.4 are shown in Figure 3. The data (not shown) at other pH values studied (5.0 – 7.4) showed no effects of pH on the interaction, which is supported by CE data and suggests that electrostatic interactions are not a major factor in forming the epicatechin-BSA complex. Using the binding model discussed above it was possible to determine the binding constant, K = 213 ± 11 M-1, and the binding parameters, n = 3.3 ± 0.3 and ΔH = – 45 ± 2 kJ mol-1. Further parameters ΔG = – 13 ± 1 kJ mol-1 and ΔS = – 105 ± 5 kJ mol-1 could then be derived.
The ITC data showed agreement in the values of K and n with frontal CE analysis and the data are discussed in more detail in reference 2; further data from the analysis of protein-polyphenol interactions is discussed in reference 3. Briefly, the entropy term (ΔS) was negative, indicating that the interaction was driven by enthalpy as opposed to entropy. Negative entropy indicates an increase in molecular order, which would occur upon aggregation and may also imply a role for hydrogen bonding in the formation of the complex. The binding enthalpies imply that the interaction was non-covalent since the enthalpies are too low for covalent bond formation to have occurred (200 – 400 kJ mol-1).
Summary
CE and ITC are shown to be complementary methods for the analysis of protein-polyphenol binding interactions. ITC is the more suitable method, giving a greater amount of information on the interaction, as well as being more suited to the complexities of the protein-polyphenol interaction such as the formation of insoluble complexes. We are currently extending our work to investigate how polyphenol structure influences the binding with proteins, and whether this can be related to nutritional function.


References
- Papadopoulou, A. & Frazier, R.A. (2004) Characterisation of protein-polyphenol interactions. Trends in Food Science and Technology, 15, 186-190.
- Frazier, R.A., Papadopoulou, A. & Green, R.J. (2006) Isothermal titration calorimetry study of epicatechin binding to serum albumin. Journal of Pharmaceutical and Biomedical Analysis, in press, available online 7 March 2006, doi:10.1016/j.jpba.2006.02.004.
- Frazier, R.A., Papadopoulou, A., Mueller-Harvey, I., Kissoon, D. & Green, R.J. (2003) Probing protein-tannin interactions by isothermal titration microcalorimetry. Journal of Agricultural and Food Chemistry, 51, 5189-5195.


