Online transflectance NIR imaging of foods
- Like
- Digg
- Del
- Tumblr
- VKontakte
- Buffer
- Love This
- Odnoklassniki
- Meneame
- Blogger
- Amazon
- Yahoo Mail
- Gmail
- AOL
- Newsvine
- HackerNews
- Evernote
- MySpace
- Mail.ru
- Viadeo
- Line
- Comments
- Yummly
- SMS
- Viber
- Telegram
- Subscribe
- Skype
- Facebook Messenger
- Kakao
- LiveJournal
- Yammer
- Edgar
- Fintel
- Mix
- Instapaper
- Copy Link
Posted: 7 March 2007 | Vegard H. Segtnan, Jens Petter Wold and Martin Høy, Matforsk AS, Norway and Jens T. Thielemann and Jon Tschudi, SINTEF ICT, Norway | No comments yet
Most solid foods are heterogeneous on one level or another. Minced meat or an intact piece of meat, for example, will have smaller or larger local regions that are almost pure fat, pure lean meat or pure connective tissue. For such heterogeneous foods the distribution of the local differences is approximately the same throughout the sample.
Most solid foods are heterogeneous on one level or another. Minced meat or an intact piece of meat, for example, will have smaller or larger local regions that are almost pure fat, pure lean meat or pure connective tissue. For such heterogeneous foods the distribution of the local differences is approximately the same throughout the sample.
Most solid foods are heterogeneous on one level or another. Minced meat or an intact piece of meat, for example, will have smaller or larger local regions that are almost pure fat, pure lean meat or pure connective tissue. For such heterogeneous foods the distribution of the local differences is approximately the same throughout the sample.
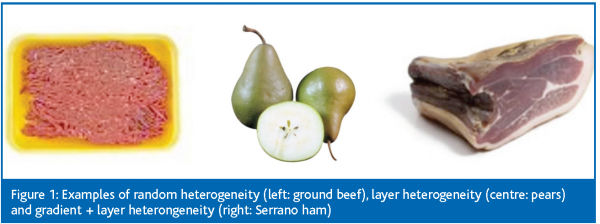
\In other foods, such as fruits and vegetables, different layers (more or less homogeneous) will have a different chemical composition. Thus, the surface of the food is not representative of the main part, i.e. the interior. A third type of heterogeneity is found in foods that have compositional gradients. An example from this group could be a dried and salted ham, which normally has more salt and less water in the exterior parts than in the interior parts. Another example could be a salmon fillet, which has fat gradients in three directions: The fat content generally increases from tail to head, from back to belly and from the centre to the skin. Additionally, a salmon fillet with skin also has layer heterogeneity.
In summary, these are the three main types of heterogeneity encountered in foods:
- Random region heterogeneity
- Layer heterogeneity
- Gradient heterogeneity (Figure 1)
Online analysis of heterogeneous foods
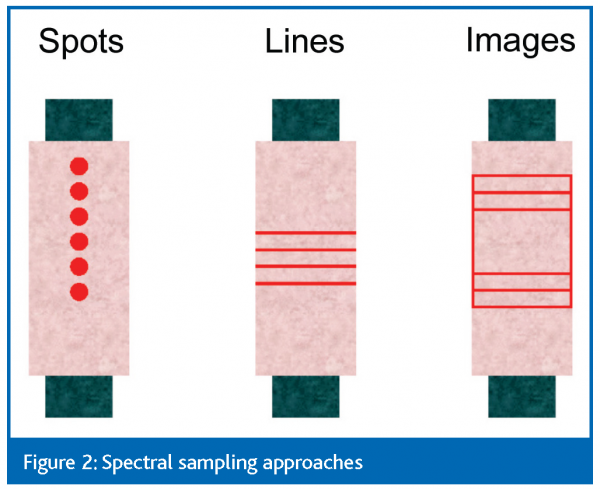
In quality analysis and process control we are normally more interested in the bulk composition of a batch of food or a discrete food product, than in the local chemical characteristics. Thus, the way we choose to approach a heterogeneous food sample with our analytical device is crucial for the relevance of the measurement. In general, we need to measure as much as possible of the heterogeneous sample in order to get the best estimate of the true average content of the analyte. Of course, the type of heterogeneity defines what approach to choose: If we have a sample with random region heterogeneity, like minced meat on a conveyor belt, where there is no systematic compositional variation in the breadth or the depth of the sample stream, we could probably get a good estimate of the average composition by measuring the reflectance in one single spot at an appropriate sampling frequency (Figure 2, left). If we have a discrete object with internal variation in the two plane dimensions (i.e. gradient heterogeneity), we would need to obtain a spectral reflectance image of the object. This could be achieved using a line scanner (Figure 2, centre) or an imaging system (Figure 2, right).
If we also have variation in the depth of the discrete sample, surface reflectance measurements would not be appropriate: We would need to measure the transmittance, i.e. the fraction of radiation that is transmitted through the sample, or the transflectance, i.e. the fraction of radiation that has been transported through the surface, some distance into the sample and back through the surface again.
Transmittance measurements are rarely practical in online food analysis due to, for example, conveyor belts and thickness differences. Thus, we are left with the transflectance principle as the most suitable. Transflectance measurements have traditionally been measured with contact probes, which is not a suitable option in online food analysis.
Online NIR transflectance
Transflectance has the practical advantage over transmission that both illumination and detection is on the same side of the sample. This reduces thickness effects considerably and provides a fairly clear measurement situation. As directly reflected light is prevented from reaching the detector, only light that has traversed the interior of the product will be analysed. Transflectance thus probes deeper into the material compared to reflectance and suppresses surface effects. Transflectance has been used to measure, for instance, sugar content in single peaches and soluble solid content in melons.1,2
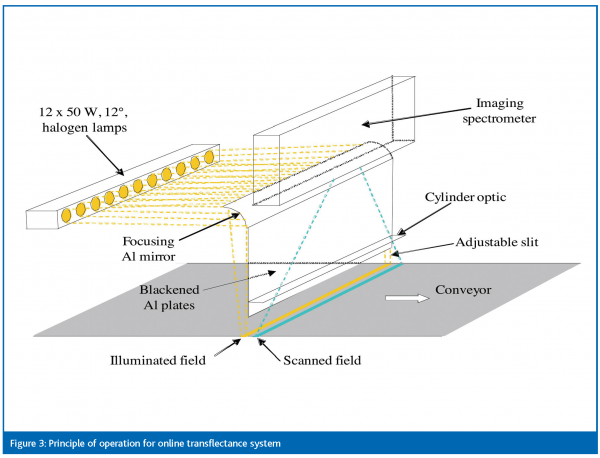
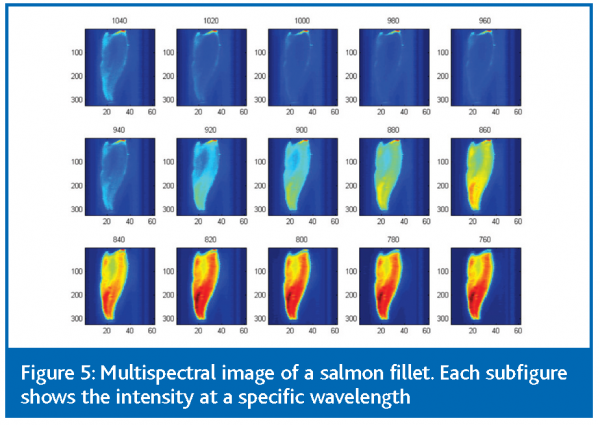
In this article we describe how non-contact NIR transflectance measurements can be combined with spectral imaging to obtain representative sampling of heterogeneous samples. In 2002 a prototype NIR system was developed for determination of water in dried and salted cod, an extremely heterogeneous product. The system relied on non-contact transflectance measurements combined with spectral imaging. It was based on a commercial NIR imaging scanner used for plastic waste sorting (Titech Visionsort, Oslo, Norway). This scanner collects spectral images of 15 wavelengths/channels at the speed of 160 000 measurements pr sec. The spectral range 760 – 1040nm with a wavelength resolution of 20nm was used. Figure 3 shows how the system was designed. The illuminating field was focused along a line across the conveyor belt. The field of spectral collection was parallel to the illuminated field, but separated by approximately 2cm. A metal plate was used to shield the detector from unwanted reflected light from the fish surface. The spatial resolution of the spectral images was approximately 10x10mm depending on the conveyor belt speed. The combination of non-contact NIR transflectance measurements with spectral imaging allows rather deep penetrating optical sampling as well as large flexibility in spatial sampling patterns and calibration regimes. The system has provided good results for many complex applications, and has now been commercialised by the Norwegian company Qvision AS.
Applications
Water contents in dried and salted cod
Dried salted cod (used for the dish bacalao) is an extremely heterogeneous product. The moisture is unevenly distributed, with high shares in the thick loin parts and much lower shares in the thinner belly flaps and tail. The surface of the fish is usually much drier than the interior and is covered by a layer of salt. The surface of the fish is rough and hard, which makes it difficult to get good physical contact between sample and a probe. The fish vary in size and thickness. Quality of split cod is today judged manually by trained graders and water content is the most important criterion in the market: low percentage of moisture gives higher price per kg fish. The accuracy for manual grading of moisture is approximately ± 2.0 %-units.
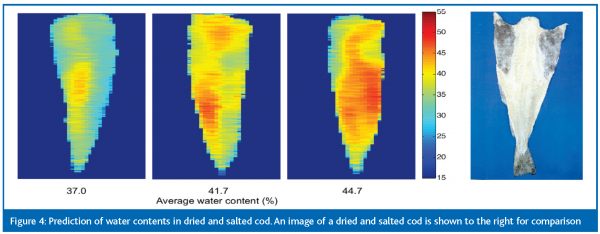
The NIR-scanner previously described has been calibrated and tested on several large sets of dried salted cod with very good results. Based on PLS regression models between NIR image data and reference values, the average water content can be estimated with an accuracy of between ±0.7 and ±1.0 % (Wold et al. 2006). In addition to the average water content per fish, the water distribution within each fish is calculated (Figure 4). The system has a capacity of approximately 60 fish per minute and is used in the salt fish industry today.
Fat contents in salmon fillets
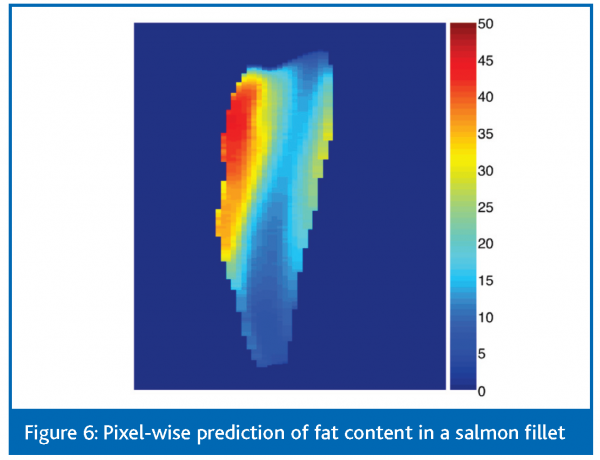
The fat content in a salmon fillet is very unevenly distributed: It generally increases from tail to head, from back to belly and from inside to skin side. As a result of this, measuring spectra in isolated spots or lines would not give a satisfactory prediction of the average fat content of the whole fillet. However, the transflectance imaging principle of the above scanner lends itself perfectly to such applications.
Due to the varying fat content, the prediction model was based on local calibrations on defined locations of the fillet. For new fillets with unknown fat content, a multispectral image of the whole fillet is obtained by letting the fillet pass under the scanner on a conveyor belt. Figure 5 shows how the fillet looks in each of the 15 wavelength channels. Based on such multispectral images, the fat content is predicted in each measured pixel of the fillet. An example of this is shown in Figure 6. The belly-part has the highest fat content, but it is also the thinnest part of the fillet. To obtain a good estimate of the average fat content of the whole fillet, it is thus necessary to weight the different areas with respect to their thickness.
The average prediction error of the model is approximately 1.0 percentage point, which is good enough for industrial online classification. This application is in routine usage at salmon producers’ today.
Fat contents in consumer packages of ground beef
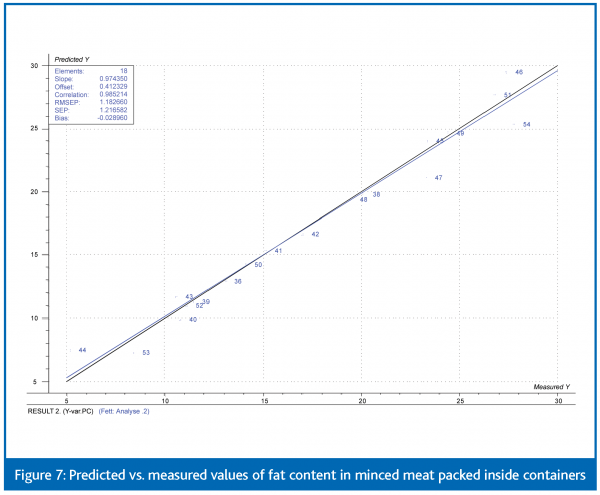
Since the measurement principle of the instrument is not based on direct reflection, it is possible to obtain spectra from packaged foods. As an example of this, we carried out a small scale experiment where samples of minced meat were surrounded by a standard gas (CO2 + N2) in consumer packages. The fat content of the samples varied from 5 to almost 30 per cent. The packages of meat were measured directly on the conveyor belt and NIR spectra were obtained through the transparent plastic on top of the packages. Reference values of the fat content were obtained by chemical analysis. Finally, the two datasets were combined using partial least squares regression. Figure 7 shows the resulting predictions together with the reference values. The results are fairly promising and this application will probably be used online in the near future.
Fat contents in potato chips
We have also carried out a small-scale experiment where the objective was to measure the fat content in potato chips as a function of frying time. In total, 60 small portions of potato chips were fried from 100 to 300 seconds. Each of the portions was measured with the above scanner-instrument and the average fat content was determined using NMR. The fat content of the samples varied from 30 to 50 per cent. A regression model was then built, predicting the average fat content of each portion using the NIR spectra. The results look promising, as the average prediction error is around one percentage point.
European projects
In the EU funded project TRUEFOOD (Traditional United Europe Food, 2006-2010) one of the objectives is to reduce the salt content of traditional food products without altering the sensory characteristics or the microbial properties of the product. One of the products investigated in this project is salted and smoked salmon. In the first part of the project, non-destructive methods for fat and salt distribution analysis are developed. For fat distribution, the Qvision scanner is used and for salt distribution, x-ray computer tomography is used. The goal is to minimise the salt contents locally on each fillet according to the fat distribution. The project comprises 31 project partners that communicate with 11 national food and drink federations.
MeatVision is a Norwegian funded project, part of the European EUREKA network E!3447 MEATVISION, where one goal is to develop rapid methods for fat determination in meat cuts and trimmings. Satisfactory on-line systems based on NIR reflectance exists for ground meat, whereas the heterogeneity of intact meat cuts requires more sophisticated optical sampling. The NIR scanner described above will therefore be evaluated for various meat applications over the next two years.







References
- Kawano, S. (1992): “Determination of sugar content in intact peaches by near infrared spectroscopy with fiber optics in interactance mode”.J. Jap. Soc. Hortic. Sci., 61, 445-451
- Greensill, C.V.; Walsh, K.B. (2000): “A remote acceptance probe and illumination for spectral assessment of internal attributes of intact fruit”. Meas. Sci. Technol., 11, 1674-1684
- Wold, J.P.; Johansen, I.R.; Haugholt, K.H.; Tschudi, J.; Thielemann, J.; Segtnan, V.H.; Narum, B.; Wold, E. (2006): “Non-contact transflectance NIR imaging for representative on-line sampling of dried salted coalfish (bacalao)”. J. NIR Spectrosc., 14, 59-66.


