Evaluating chocolate blends
- Like
- Digg
- Del
- Tumblr
- VKontakte
- Buffer
- Love This
- Odnoklassniki
- Meneame
- Blogger
- Amazon
- Yahoo Mail
- Gmail
- AOL
- Newsvine
- HackerNews
- Evernote
- MySpace
- Mail.ru
- Viadeo
- Line
- Comments
- Yummly
- SMS
- Viber
- Telegram
- Subscribe
- Skype
- Facebook Messenger
- Kakao
- LiveJournal
- Yammer
- Edgar
- Fintel
- Mix
- Instapaper
- Copy Link
Posted: 3 May 2005 | S.J. Millar and A.G. Hall, Baking and Cereals Processing Department, Campden & Chorleywood Food Research Association | No comments yet
Chocolate is widely appreciated globally as a luxury food. Although its introduction to Europe and the rest of the world occurred some 500 years ago, the cocoa bean had been recognised as a highly significant plant in South America for thousands of years prior to that – having been cultivated by the Aztecs.
So prized was their drink (chocolatl, derived from the bean) that it was referred to as ‘the food of the gods’ in their mythology. In turn, this was clearly an influence many years later when the genus, of which the cacao species is a part, was named Theobroma – a derivation of the Greek words for God (Theos) and food (broma) (Russell Cook, 1963).
Chocolate is widely appreciated globally as a luxury food. Although its introduction to Europe and the rest of the world occurred some 500 years ago, the cocoa bean had been recognised as a highly significant plant in South America for thousands of years prior to that – having been cultivated by the Aztecs. So prized was their drink (chocolatl, derived from the bean) that it was referred to as ‘the food of the gods’ in their mythology. In turn, this was clearly an influence many years later when the genus, of which the cacao species is a part, was named Theobroma – a derivation of the Greek words for God (Theos) and food (broma) (Russell Cook, 1963).
Chocolate is widely appreciated globally as a luxury food. Although its introduction to Europe and the rest of the world occurred some 500 years ago, the cocoa bean had been recognised as a highly significant plant in South America for thousands of years prior to that – having been cultivated by the Aztecs.
So prized was their drink (chocolatl, derived from the bean) that it was referred to as ‘the food of the gods’ in their mythology. In turn, this was clearly an influence many years later when the genus, of which the cacao species is a part, was named Theobroma – a derivation of the Greek words for God (Theos) and food (broma) (Russell Cook, 1963).
The strong appeal of chocolate is still evident today and a significant part of the pleasant eating experience is due to two fundamental characteristics of the raw material.
- Cocoa beans possess unique flavour components that cannot be obtained from other plants (Biehl and Ziegleder, 2003)
- Cocoa butter has a sharp melting profile that gives a pleasurable cooling sensation in the mouth without leaving any residual solid fat (Talbot, 1999)
While being produced from a relatively small number of basic ingredients, the process of chocolate manufacture is dependent on having those ingredients in the appropriate physical forms to generate the desired mouthfeel and flavour. The different chocolate types are also defined on the basis of the ingredients that are present and their relative proportions (CCFRA, 2003). In the UK, the three main types of chocolate may be defined as follows:
- Chocolate is defined as containing not less than 35% total dry cocoa solids; including not less than 18% cocoa butter and not less than 14% dry non-fat cocoa solids
- Milk chocolate is defined as containing not less than 25% total dry cocoa solids; not less than 14% dry milk solids; not less than 2.5% dry non-fat cocoa solids; not less than 3.5% milk fat and not less than 25% total fat
- White chocolate is defined as containing not less than 20% cocoa butter; not less than 14% dry milk solids and not less than 3.5% milk fat
As a result of these differences, it is important for processors of chocolate to ensure that unwanted blending does not occur where different types of chocolate may be used by the same processing equipment. The work described in this article was initiated with a view to assessing the potential of near infrared (NIR) spectroscopy for the determination of the proportion of one chocolate type in another. This is a technique that has been widely applied within the agricultural and food industries for rapid analysis of the composition and functionality of raw materials and products. It is based upon the interaction of a material with matter as a function of the absorption of energy by molecular bonds, such as C-H, O-H and N-H, as well as the interaction of the radiant energy with the physical structure of the food. The absorbance bands typically studied are those in the wavelength range 1100-2500nm where overtone and combination bands relating to the fundamental absorption in the mid infrared region (2500-25000nm) may be found. Due to the overlapping nature of these bands and the physical characteristics of the foodstuff, mathematical equations (calibrations) are typically derived to relate accepted measures of functionality or composition with the NIR spectrum.
The work described was undertaken to determine whether the NIR region could be used more effectively than the visible region for evaluation of chocolate blends and, if so, to develop a demonstration calibration to highlight the feasibility of the NIR approach.
Assessment of chocolate blends
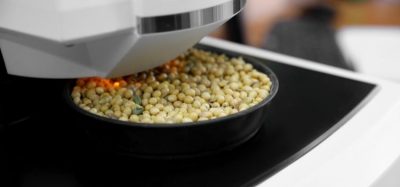
Samples of dark and white chocolate were supplied in solid blocks by an industrial confectionery producer and blended by mass as solid material prior to melting in a microwave oven. Blends were then stirred prior to placing in a pre-warmed sample holder for presentation to the NIR instrument (Foss NIRSystems 6500). NIR spectra were collected with the chocolate at approximately 33ºC to ensure consistency for the different blends and to represent typical temperatures used when pumping chocolate during commercial processing. In addition to determining the impact of changing the proportions of the two chocolate types on NIR spectra, calibrations were also developed using partial least squares (PLS) regression.
Chocolate blend differences
Example spectra (Figure 1) of pure white and dark chocolate demonstrate strong differences in the visible region (400-700nm) as would be expected, given their differences in visible appearance. The NIR region (1100-2500nm) also shows some differences, although the magnitude of these is less than those in the visible. This is not surprising as it is generally the case that additional mathematical treatment of NIR is required to highlight the true differences between materials. As would be expected, given the main components of chocolate, the NIR spectra are typical of a material containing sucrose, with absorbance bands at 1440, 1520, 1580, 2080 and 2200nm; lipid, with absorbance doublets at 1725/1765 and 2310/2340nm and low levels of moisture (with only a small absorbance band at 1940nm).
Given the large differences in the visible region of the spectrum, it was interesting to compare the different blends visually (Figure 2). Here, the dark chocolate dominated their appearance with small levels of it being obvious in a white chocolate base, while the reverse situation showed very little obvious evidence of the contribution of white chocolate. These results were confirmed using a colorimeter where it was clear that this technique would be sensitive to contamination of white chocolate with dark, but not the reverse. While this may not be important in terms of appearance, it would be important to a producer wishing to ensure that no milk derivatives were present in a batch of dark chocolate, in which case sensitivity to white chocolate against a base of dark chocolate would be highly relevant.
Difference spectra were calculated demonstrating the impact of changing the proportions of the two chocolate types for both the visible and NIR regions (Figure 3). The shape of these curves in the NIR region indicated that the differences between dark and milk chocolate, is mainly due to the regions associated with sucrose, rather than lipid. The direction of the spectral difference indicates that the white chocolate had a higher sucrose content than the dark chocolate, which would be consistent with the expected difference in taste profile. The fact that the spectral regions associated with lipid content did not show a similar effect would indicate that the lipid contents were broadly similar, even if the source of the lipid would differ with the white chocolate containing milk fat as well as cocoa butter.
Given the evidence of differences in composition to which NIR was sensitive, a calibration was developed to predict the proportion of white chocolate in a blend of dark and white chocolate. The number of samples used in this exercise was smaller than would be considered optimal, but the purpose of the exercise was to demonstrate feasibility recognising that further work using a larger sample set would be required to generate a calibration sufficiently robust for future use. Cross-validation was used as a part of the calibration process to aid in the selection of the variables to include in the final model, as well as to provide a more robust estimate of future calibration performance. The results (Figure 4) indicate that the NIR method has considerable potential, demonstrating high levels of accuracy as well as consistency of performance across the measurement range. This was the case when even a small amount of white chocolate was blended into a dark chocolate base.
The standard error of calibration (SEC) is a measure of the underlying difference between the values determined by the NIR calibration and those known, i.e. those derived from the masses originally blended. This is a useful indicator of calibration performance but tends to demonstrate better accuracy than would be the case for independent samples, as the performance is effectively being tested using the same samples as were used in the calibration development and, as such, represents the optimised case. As would be expected, the value for the standard error of cross validation (SECV) was higher indicating that a prediction of samples not used in the development of the calibration would be less accurate. Nevertheless, this result was still of interest, indicating that a user of the calibration could expect the value obtained by NIR to be within ±1.42% of the true value for 95% of the determinations carried out. At this stage this would not be sufficiently accurate for use in critical applications (such as evaluation of the likelihood of potential allergens, like milk proteins, being present). It should, however, be recognised that this is a calibration developed using a small calibration set. It would be anticipated that the performance would improve further with additional samples. Even at this level, however, the performance of the current calibration would probably be sufficient for control of commercial blending operations where the aim was simply to ensure that the required quantities of chocolate were being used or to alert operatives when inadvertent blending was occurring (during production changeovers for example).
Summary
Chocolate is a high value foodstuff for which purity of the final product is important in terms of consumer acceptability, as well as to ensure compliance with labelling legislation. The use of NIR has significant potential as a rapid and cost-effective means of controlling aspects of chocolate processing. Given the accepted use of the technique for compositional analysis of foods, its broader application in evaluating the characteristics of the raw materials in chocolate production, as well as for the assessment of blending operations, may be envisaged. Such a combined approach would be expected to aid processors in maintaining the high levels of efficiency required in current food production.


References
Biehl, B. and Ziegleder, G. (2003). Cocoa production, products and use. In: Encyclopedia of Food Sciences and Nutrition (Eds B. Caballero, L.C. Trugo and P.M. Fingas). pp 1448-1463. Academic Press, Oxford
CCFRA (2003). Food Law Notes 15. Cocoa and chocolate products. February 2003
Russell Cook, L. (1963). Chocolate Production and Use. Magazines for Industry, Inc., New York
Talbot, G. (1999). Chocolate temper. In: Industrial Chocolate Manufacture and Use (Ed S.T. Beckett). pp 218-230. Blackwell Science Ltd, Oxford