Assessing sanitation: A comparison performance testing of ATP systems
- Like
- Digg
- Del
- Tumblr
- VKontakte
- Buffer
- Love This
- Odnoklassniki
- Meneame
- Blogger
- Amazon
- Yahoo Mail
- Gmail
- AOL
- Newsvine
- HackerNews
- Evernote
- MySpace
- Mail.ru
- Viadeo
- Line
- Comments
- Yummly
- SMS
- Viber
- Telegram
- Subscribe
- Skype
- Facebook Messenger
- Kakao
- LiveJournal
- Yammer
- Edgar
- Fintel
- Mix
- Instapaper
- Copy Link
Posted: 28 October 2015 | NSF International | No comments yet
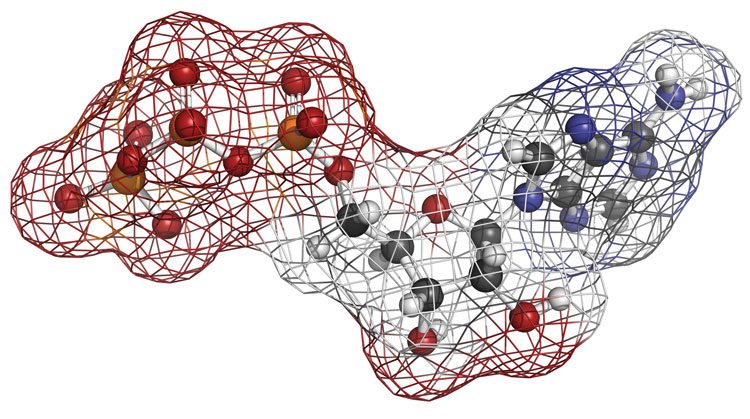
Adenosine triphosphate (ATP) is a compound found in every living cell and can be used as an indicator to determine if a surface was properly sanitised. ATP devices are utilised to detect the presence of bacteria and organic/food residue on surfaces. This study was directed by NSF International, performing comparison performance testing of five different commercially available ATP systems.

The recovery efficiency and consistency of each system were evaluated against an ATP standard solution and orange juice at different dilutions inoculated onto stainless steel carriers. The study utilised varying methods to determine the effectiveness of each system; both a directly pipetted ATP standard solution and commodity onto swab surfaces, and surface swabbing of stainless steel coupons were employed with the test systems.
ATP hygiene monitoring systems have been used in the food production industry for over 20 years. The systems are used in facilities to measure the cleaning effectiveness, removal/reduction of ATP, on food contact surfaces. ATP has been incorporated as a key monitoring parameter for the food, beverage and healthcare industries. It is essential that these devices provide precise and consistent readings so that the hygiene practices of these industries can be accurately evaluated.
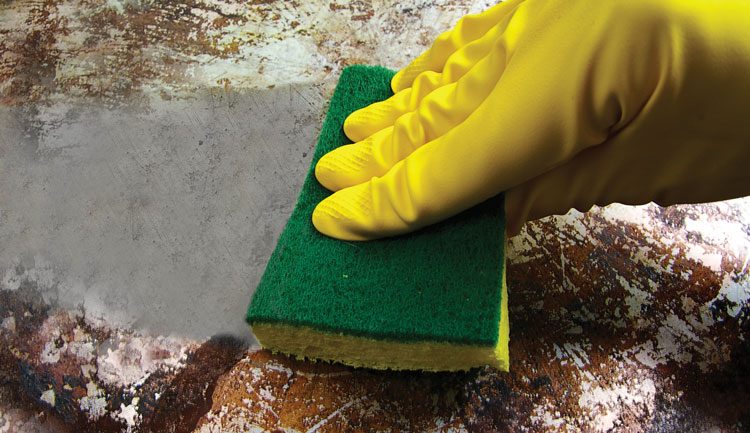
Our study attempts to mirror typical field usage by looking at the recovery of each system of ATP standards and commodity from a common surface (stainless steel).
ATP devices
Multiple manufacturers produce monitoring systems to detect ATP. The following systems were selected to be tested in this study.
- Neogen AccuPoint Advanced ATP Surface Samplers (Lot 216036)
- 3M Clean-Trace Surface ATP (Lot 1222C)
- Hygiena UltraSnap (Lot 02515)
- Charm PocketSwab Plus (Lot 4031315A-01)
- Biocontrol LIGHTNING MVP ICON ATP Surface Sampling Device (Lot 042915-01)
Methodology
Evaluations of the sanitation systems were conducted in four sections:
Section 1. The goal of this experimental section was to determine the Relative Light Unit (RLU) response for each of the five test systems that corresponded to standard ATP solutions added directly to the sampling system. For each sanitation system, 20uL of each ATP standard (0, 12.5, 25.0, and 100 femtomoles of ATP) was pipetted directly onto the sample swab or pad of the sanitation system. Immediately following addition of the ATP standard to the sample pad or swab the instructions for the system were followed and the sampler was read on the appropriate luminescence reader. Each ATP concentration including a blank (sterile water) was tested 25 times using 25 different samplers. The ATP solutions were labelled by nanomolar concentration and 20μL of the 5.00, 1.25 and 0.625nM solutions of ATP or sterile water result in the following femtomoles of ATP on the sample pad or swab, 100, 25.0, 12.5 and 0 femtomoles, respectively. Results for the 100 femtomole solution are reported in Table 1. The calculated mean RLU response for the 100 femtomole solution was used as a reference for calculating ATP recovery for the experiments performed in Sections 2 and 3.
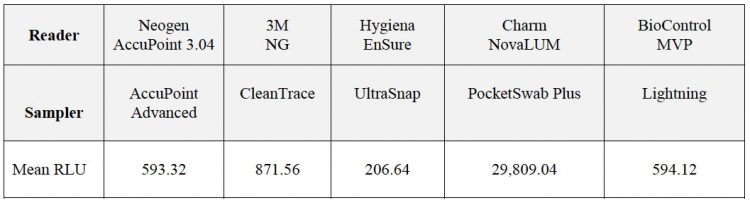
Table 1: Mean RLU response of five ATP monitoring systems against an ATP standard of 100 femtomoles. ATP standard solutions were pipetted directly onto sample swabs. Mean was taken of 25 replicates (n=25) and reported. Data obtained was used as a reference for the calculation of ATP recovery in Sections 2 and 3, Tables 2 and 3 respectively. (Data recorded under NSF J-00170817)
Section 2. The goal of this experimental section was to determine the efficiency of the five test systems in recovering an ATP standard that had been evenly spread across a stainless steel carrier. The surface recovery of ATP or commodities was determined by using a 4”x4” stainless steel plate. The initial cleanliness of the stainless steel plates was important to monitor and the testing was conducted in a laminar flow hood equipped with a UV lamp. Prior to each round of testing the stainless steel plates were cleaned and sterilised using a UV lamp with a twenty minute exposure. Between experiments the stainless steel plates were cleaned using 10% Contrad 70 in water, rinsed with sterile water, washed again with isopropanol and then air dried.
Sterile water and isopropanol used for cleaning was dispensed from a spray bottle which was sterilized using a UV lamp (20 minute exposure) and 10% Contrad 70 in water. Periodically a 4”x4” plate was checked for cleanliness using an AccuPoint sampler to ensure the reading was at background levels (below 25 RLU).
100 femtomoles of ATP was spread over the 4”x4” surface and air dried for one hour at room temperature (18-25˚C) to measure the amount of ATP that could be recovered utilising each monitoring system. This was accomplished by pipetting 20μL of a 5.0nM ATP solution onto the stainless steel surface. The tip of a pipette was used to distribute the solution over the surface. Ten 4”x4” stainless steel squares were covered with 100 femtomoles of ATP for each sanitation system. After the ATP was deposited homogenously across and dried, the surface was sampled using the sanitation system sampler in the manner recommended by the manufacturer’s instructions. The amount of ATP was recovered was determined by comparing the mean response from the surface recovery to the mean response obtained in Section1. Results are reported in Table 2.
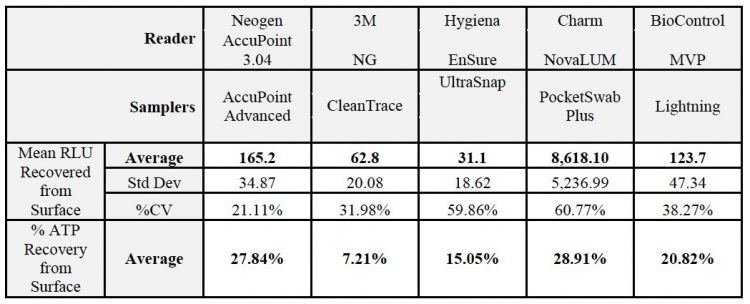
Table 2: Recovery of ATP standards from a homogenously contaminated stainless steel surface. A 100 femtomole ATP solution was homogenously deposited over a 4″x4″ stainless steel surface. The surface was then sampled with the referenced monitoring systems utilizing a real world approach swabbing technique (5 seconds in one direction, and then swabbing 5 more seconds perpendicular to the first). The mean RLU was calculated of 10 replicates (n=10) and reported. To calculate percent ATP recovery, the direct inoculation mean RLU recovery values (Table 1) were used as a reference.
Section 3. The goal of this experimental section was to determine the efficiency of the five test systems in recovering an ATP standard that had been spot inoculated at a random location on a stainless steel carrier. A 20μL of the 5.0nM ATP solution (100 femtomoles) was pipetted at a random spot on a 4”x4” stainless steel surface to determine the recovery capability of each monitoring system. The spot was allowed to dry for one hour and the plate was sampled according to the manufacturers sampling instructions. This was repeated 10 times for each sanitation monitoring system to determine the mean response, standard deviation and the coefficient of variation (CV) for the recovered ATP from the surface. The percentage recovered from the surface was determined by comparing the mean response from the surface spot recovery to the mean response obtained in Section 1. Results are reported in Table 3.
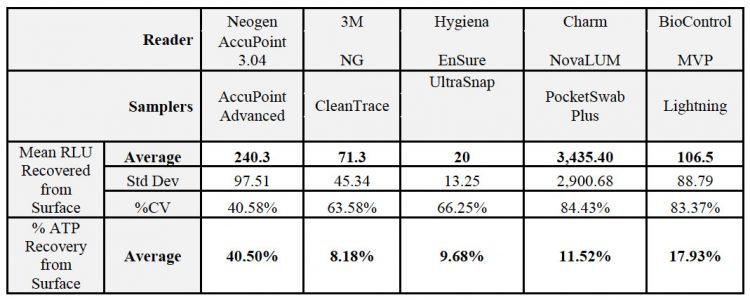
Table 3: Recovery of an ATP standard from a single contamination spot on stainless steel surfaces. A 100 femtomole ATP standard solution was deposited randomly as as a drop on a 4″x4″ stainless steel surface. The surface was then sampled with the referenced monitoring systems utilizing a real world swabbing approach technique (5 seconds in one direction, and then swabbing 5 more seconds perpendicular to the first). The mean RLU was calculated of 10 replicates (n=10) and reported. To calculate percent ATP recovery, the direct inoculation mean RLU recovery values (Table 1) were used as a reference.
Section 4. The goal of this experimental section was to determine the efficiency and detection limit of the five test systems in recovering a standard commodity, orange juice, which had been evenly spread across a stainless steel carrier. This experiment was designed to replicate a typical situation that would be encountered in the field. For this evaluation, 10mL of orange juice was diluted 1:1000 (1 part orange juice to 999 parts sterile water), 1:5000 (1 part orange juice to 4999 parts sterile water), and 1:10000 (1 part orange juice to 9999 parts sterile water).
Surfaces for each dilution level were prepared by dispensing 50 μL of a given dilution level across the surface of a 4”x4” section of stainless steel plate and allowing the samples to dry for one hour before sampling the surface according to the prescribed method for each brand of system. Ten surfaces were prepared and sampled at each dilution for each brand of sanitation systems. The mean, standard deviation and coefficient of variation was determined for each dilution and each brand of sanitation sampler.
To determine recovery, 50μL of each orange juice dilution was pipetted directly onto the swab or sample pad and the response measured using each brand of sanitation system. This was repeated 10 times to determine the mean response for directly pipetting the orange juice dilution onto the sampler. The percentage recovered from the surface was determined by comparing the mean response from the surface recovery to the mean response obtained from directly pipetting 50μL onto the samplers. Results are reported in Table 4.
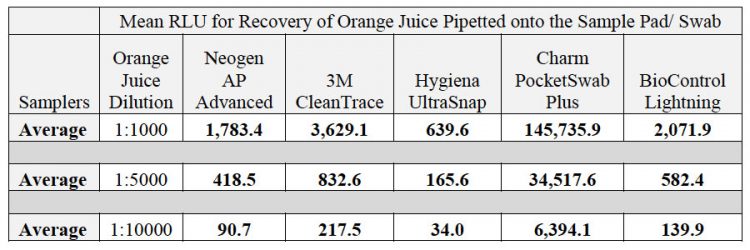
Table 4: Recovery of ATP from stainless steel surfaces inoculated with varying concentrations of orange juice. Orange juice was selected as an ATP source since it is a standard commodity product. Three dilutions of orange juice were utilized: 1:1,000, 1:5,000 and 1:10,000. Table 4a: RLU values observed when the dilutions were amended directly to the ATP monitoring system’s sample pad/swab. These RLU values were used as a reference for the calculation of percent ATP recovery in Table 4c. The average RLU reading from 10 replicates (n=10) is reported.
Results and discussion
This study aimed to examine the difference in recovery of ATP standards when applied in a homogenous manner across the carrier as well as to a random spot contamination. The study also assessed the ability of the five ATP monitoring systems to detect a standard commodity food, orange juice, which was applied to carriers in varying concentrations.
During Section 1 of this study, the RLU (Relative Light Unit) outputs for the five test systems were observed when ATP standards were directly introduced onto the swabs/sample pads. The mean RLU output was calculated for 25 replicates and reported in Table 1. This table contains the RLU observations for all five systems tested at the 100 femtomole ATP concentrations. The RLU data generated in Section 1 for was used as a reference for calculating ATP recovery in Sections 2 and 3.
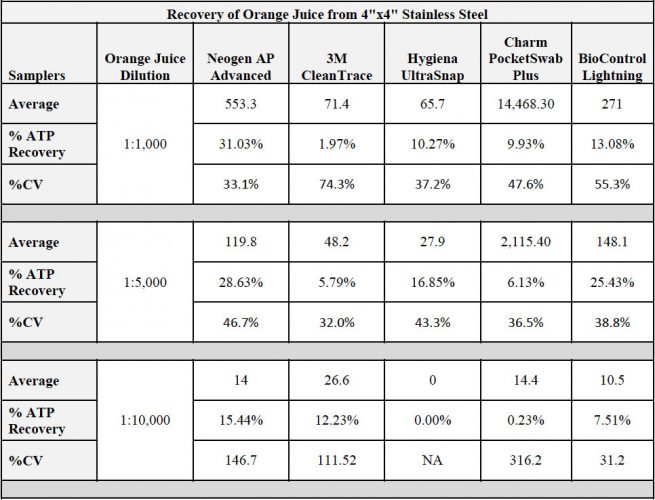
Table 4b: RLU values observed from sampling 4″x4″ stainless steel surfaces amended with three dilutions of orange juice. Percent recovery was calculated by dividing the mean RLU values below (homogenous stainless steel coupon inoculation) by the mean RLU values in Table 4a (direct swab inoculation). The dilutions were applied homogenously and the surfaces were sampled utilizing with a real world swabbing approach (5 seconds in one direction, and then swabbing 5 more seconds perpendicular to the first). The average RLU reading from 10 replicates (n=10) is reported.
Section 2 of the study utilised stainless steel coupons prepared with the 100 femtomole of the reference ATP standard as the sample. The surface was sampled using the monitoring systems’ operational instructions but utilizing a real world approach to the exposure time of the swab contact on the sample surface. A standard run/return pattern was used over the sample coupon on two axis/sides. Each side had the timed exposure of swab to surface of five seconds making the entire exposure 10 seconds. This time frame is relevant to compare the results of a lab study to a real world, situational use of the monitoring system. The percent of ATP recovered was determined by comparing the mean response from the surface recovery to the mean response of direct swab inoculation observed in Section 1. Table 2 contains the results for the Section 2 study. The two monitoring systems that had the highest percent ATP recovery from the stainless steel surfaces were the Charm PocketSwab Plus (28.91%) and the Neogen AccuPoint Advanced system (27.84%). The Neogen AccuPoint Advanced system also displayed the lowest percent coefficient of variance (21.11%), indicating that it achieved the most consistent (least variable) readings.
Section 3 involved assessing the ATP recovery efficiencies from stainless steel coupons with a random spot of 5.0 nM ATP solution of 100 femtomoles dried on it. The surfaces of 10 replicant coupons were sampled utilising the real world situational sampling method utilising each of the five monitoring systems to determine the mean response of each unit.
The percentage recovery was calculated by comparing the mean response from the surface spot recovery to the mean response of direct swab inoculation observed in Section 1. The results for Section 3 can be found in Table 3. The results show that the Neogen AccuPoint Advanced had the highest percentage recovery of all five monitoring systems at 40.50% recovery of the ATP solution from the unit surface. This system also exhibited the greatest consistency in readings (with a CV of 21.11%). The next closest system was BioControl MVP system at 17.93% recovery.
In Section 4 the experimental protocol was designed to mimic real world contamination scenarios. This study involved contaminating stainless steel surfaces with orange juice at three dilutions: 1:1,000, 1:5,000 and 1:10,000. RLU reference values for each dilution were first generated by direct inoculation onto the ATP monitoring system swabs. Recovery sampling using a real world approach, as previously described, was performed on homogenously inoculated stainless steel surfaces. The percentage recovered from each surface was determined by comparing the RLU of the surface reading with the RLUs observed from direct swab inoculation. Table 4 provides the results for the RLUs observed from direct inoculation (4a), RLUs from stainless steel recovery and calculated percent ATP recovery (4b). Once again, the Neogen AccuPoint Advanced had the highest observed percentage recovery. The next closest system for recovery at 1:1000 and 1:5000 dilution factors was BioControl MVP. For the 1:10000 dilution factor the 2nd highest recovery was the 3M CleanTrace.
References
1. B.Steiner and R.Sarver (2014) Sanitation Sampler Assay Protocol. Neogen Biochemistry Laboratory.