Application of non-destructive techniques for the monitoring of red wine fermentation
- Like
- Digg
- Del
- Tumblr
- VKontakte
- Buffer
- Love This
- Odnoklassniki
- Meneame
- Blogger
- Amazon
- Yahoo Mail
- Gmail
- AOL
- Newsvine
- HackerNews
- Evernote
- MySpace
- Mail.ru
- Viadeo
- Line
- Comments
- Yummly
- SMS
- Viber
- Telegram
- Subscribe
- Skype
- Facebook Messenger
- Kakao
- LiveJournal
- Yammer
- Edgar
- Fintel
- Mix
- Instapaper
- Copy Link
Posted: 4 January 2012 | Susanna Buratti and Gabriella Giovanelli, Department of Food Science and Technology, University of Milan | No comments yet
The rapid pace of change in the wine industry calls for fast methods providing real time information in order to assure the quality of the final product. NIR and MIR spectroscopy combined with sensory-instrumental methods (electronic nose and electronic tongue) can provide an ideal solution to monitor molecular and sensory changes in wine during alcoholic fermentation. The objective of this work was to investigate the potential of NIR and MIR spectroscopy, electronic nose and electronic tongue associated with chemometric data analysis to monitor time-related changes that occur during red wine fermentation. Micro-fermentation trials were conducted during the 2008 and 2009 vintages in Valtellina viticultural area (Northern Italy). During fermentation, at each sampling time, spectra were collected by FT-NIR and FT-IR spectrometers and samples were analysed by electronic nose and electronic tongue. Chemical analyses were performed to evaluate sugar, phenolic compounds, ethanol and glycerol concentrations. Various multivariate statistical methods were applied in order to obtain regression and classification models.
One of the most promising directions for the development of new methods is the application of sensor systems, whose speed and on-line capabilities meet the demand of automation and continuous process control. Electronic nose and electronic tongue are technological attempts to mimic human senses. Both devices consist of chemical sensor arrays, coupled with an appropriate pattern recognition system able to produce a fingerprint of the product.
The rapid pace of change in the wine industry calls for fast methods providing real time information in order to assure the quality of the final product. NIR and MIR spectroscopy combined with sensory-instrumental methods (electronic nose and electronic tongue) can provide an ideal solution to monitor molecular and sensory changes in wine during alcoholic fermentation. The objective of this work was to investigate the potential of NIR and MIR spectroscopy, electronic nose and electronic tongue associated with chemometric data analysis to monitor time-related changes that occur during red wine fermentation. Micro-fermentation trials were conducted during the 2008 and 2009 vintages in Valtellina viticultural area (Northern Italy). During fermentation, at each sampling time, spectra were collected by FT-NIR and FT-IR spectrometers and samples were analysed by electronic nose and electronic tongue. Chemical analyses were performed to evaluate sugar, phenolic compounds, ethanol and glycerol concentrations. Various multivariate statistical methods were applied in order to obtain regression and classification models. One of the most promising directions for the development of new methods is the application of sensor systems, whose speed and on-line capabilities meet the demand of automation and continuous process control. Electronic nose and electronic tongue are technological attempts to mimic human senses. Both devices consist of chemical sensor arrays, coupled with an appropriate pattern recognition system able to produce a fingerprint of the product.
The rapid pace of change in the wine industry calls for fast methods providing real time information in order to assure the quality of the final product. NIR and MIR spectroscopy combined with sensory-instrumental methods (electronic nose and electronic tongue) can provide an ideal solution to monitor molecular and sensory changes in wine during alcoholic fermentation. The objective of this work was to investigate the potential of NIR and MIR spectroscopy, electronic nose and electronic tongue associated with chemometric data analysis to monitor time-related changes that occur during red wine fermentation. Micro-fermentation trials were conducted during the 2008 and 2009 vintages in Valtellina viticultural area (Northern Italy). During fermentation, at each sampling time, spectra were collected by FT-NIR and FT-IR spectrometers and samples were analysed by electronic nose and electronic tongue. Chemical analyses were performed to evaluate sugar, phenolic compounds, ethanol and glycerol concentrations. Various multivariate statistical methods were applied in order to obtain regression and classification models.
One of the most promising directions for the development of new methods is the application of sensor systems, whose speed and on-line capabilities meet the demand of automation and continuous process control. Electronic nose and electronic tongue are technological attempts to mimic human senses. Both devices consist of chemical sensor arrays, coupled with an appropriate pattern recognition system able to produce a fingerprint of the product. The electronic nose consists of an array of gas sensors with different selectivity1. The electronic tongue is a device based on sensor arrays able to recognise tastes2 or to give information about groups of substances present in complex liquid systems3.
Infrared spectroscopy, in both near and mid regions, represents a fast and non-destructive method, which is alternative to conventional chemical analyses for in-time monitoring of various products and processes. Absorption in these spectral ranges can be related to the main chemical components of food, such as proteins, carbohydrates, fats and water. Infrared spectroscopic techniques have already been employed in many applications, both in the laboratory and in on-line control in industrial plants4.
In this work infrared spectroscopy, electronic nose and electronic tongue were applied and combined with multivariate statistical methods to monitor time-related changes occurring during red wine fermenta – tion in order to classify samples on the basis of their fermentation stage and to predict chemical parameters.
All these techniques represent a valid alternative to the usual destructive analytical methods for their rapidity and simplicity. Furthermore, they are advantageous in terms of environment protection and safety, since no chemicals are needed and no hazards are associated with this kind of determinations.
Experimental
Micro-fermentation trials (grapes Nebbiolo, ecotype Chiavennasca) were carried out at a controlled temperature (19±2°C), using active dry yeast inoculum (S. cerevisiae). For each trial, samplings were performed at subsequent times during fermentation.
The determination of glucose, fructose, ethanol, glycerol, total phenols, total anthocyanins and total flavonoids was carried out to follow the evolution of the chemical parameters during must-wine fermentation5.
NIR spectral data were collected in transmission mode using a flow cell of one millimetre path length with a Fourier Transform (FT)-NIR spectrometer (MPA, Bruker Optics, Ettlingen, Germany). The spectral data were collected over the range 12,500 to 3,600 cm-1.
FT-IR measurements were performed with a spectrometer (VERTEX 70, Bruker Optics, Ettlingen, Germany) equipped with a deuterated triglycine sulfate (DTGS) detector. The spectral data were collected over the range 4000 to 700 cm-1. The samples were positioned on a germanium crystal ATR (Attenuated Total Reflectance) with multiple reflection.
Electronic nose measurements were performed with PEN2 (Win Muster Airsense Analytics Inc., Germany), operating with the Enrichment and Desorbtion Unit (EDU)6.
Electronic tongue measurements were performed with the Taste-Sensing System SA 402B (Intelligent Sensor Technology Co., Ltd., Japan). In this work, five detecting sensors were used, specific for the evaluation of saltiness, sourness, bitterness and aftertaste bitterness, astringency and aftertaste astringency.
During micro-fermentation trials, sugar consumption and ethanol and glycerol production were modelled by the Gompertz equation7. A general form of the Gompertz equation was applied: where μmax represents the maximum specific growth rate, λ the length of the lag phase and C∞ the curve asymptote. For ethanol and glycerol production, C is the metabolite concentration at time t and C∞ is the concentration at time ∞; for glucose and fructose consumption, C= C0-C (i.e., the amount of sugar consumed at time t) and C∞ is the sugar consumed at the asymptotic value. Principal Component Analysis (PCA)8 was applied to spectral, electronic nose and electronic tongue data. Before performing PCA calculation, the NIR spectral data were standardised by Standard Normal Variate (SNV), while the MIR spectral data were standardised by SNV and transformed into first derivative (Savitzky–Golay method, gap size = 15 data points). All spectral data sets were also meancentred. For spectroscopic analysis, PCA was performed over the ranges 8836-5349 cm-1, 4902- 4177 cm-1 in the near region and in the range 3992 – 2495 cm-1, 1971 – 833 cm-1 in the medium region.
The classification models were developed by Linear and Quadratic Discriminant Analysis (LDA and QDA)9. When dealing with MIR and NIR spectra, Discriminant Analysis was calcu – lated on the scores derived by Principal Component Analysis. Genetic Algorithms (GA) were applied to select subsets of spectral ranges, electronic nose and electronic tongue variables that maximised the predictive power of classification models10.
The spectral data were correlated with chemical parameters by Partial Least Squares (PLS) regression algorithm. To evaluate the calibration performance, the coefficient of correlation (rcv) and the root mean square error in cross-validation (RMSECV) were computed11.
Chemical analysis
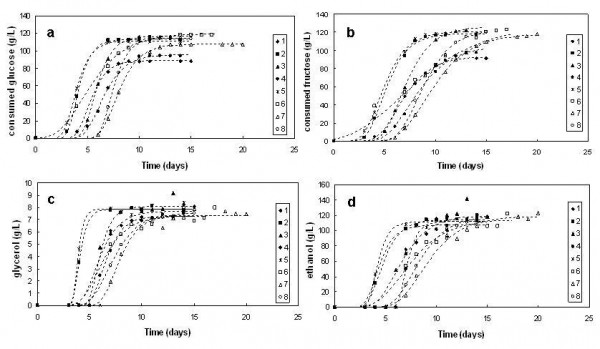
Table 1 shows changes of chemical constituents involved in the alcoholic fermentation (glucose, fructose, ethanol and glycerol). Average values and the corresponding standard deviation measured at the beginning (t0) and at the end (tf) of the micro-fermentation trials are reported. During the alcoholic fermentation, carbohydrates are transformed into ethanol by yeast enzymes until they are totally consumed. Ethanol concentration at the end of the process ranged from 112 to 141 g L-1 and glycerol content was approximately 8 – 9 g L-1. The evolution of sugar consumption and alcohol production during the microfermentation trials are shown in Figure 1 as modelled by the Gompertz equation; the r2 values were always higher than 0.98.
Table 1 Average values and the relative standard deviation for glucose, fructose, ethanol and glycerol, measured at the beginning (t0) and at the end of the process (tf)
|
Fermentation trial |
Glucose (g L-1) |
Fructose (g L-1) |
Ethanol (g L-1) |
Glycerol (g L-1) |
||||
|
t0 |
tf |
t0 |
tf |
t0 |
tf |
t0 |
tf |
|
|
1 |
88.3±4.7 |
nd |
91.7±5.0 |
nd |
nd |
118.4±0.7 |
nd |
8.1±0.1 |
|
2 |
112.6±1.1 |
nd |
116.7±1.6 |
nd |
nd |
112.4±0.5 |
nd |
7.8±0.1 |
|
3 |
116.2±2.5 |
nd |
122.6±2.6 |
nd |
nd |
141.1±3.6 |
nd |
9.2 ±0.1 |
|
4 |
94.0±1.3 |
nd |
97.4±0.1 |
nd |
nd |
117.6±1.0 |
nd |
7.5±0.1 |
|
5 |
110.8±3.9 |
nd |
118.3±4.1 |
nd |
nd |
119.4±2.7 |
nd |
8.4 ±0.1 |
|
6 |
118.1±5.9 |
nd |
123.0±6.0 |
nd |
nd |
121.7±0.5 |
nd |
8.0±0.1 |
|
7 |
107.5±2.9 |
nd |
118.0±3.3 |
nd |
nd |
122.8±1.7 |
nd |
7.5±0.1 |
|
8 |
114.1±1.6 |
nd |
120.3±1.4 |
nd |
nd |
118.0±0.7 |
nd |
7.6±0.1 |


FIGURE 1 Kinetics of fermentation parameters during the micro-fermentation trials; a: glucose consumption, b: fructose consumption, c: glycerol production, d: ethanol production
NIR and MIR spectroscopy, electronic nose and electronic tongue
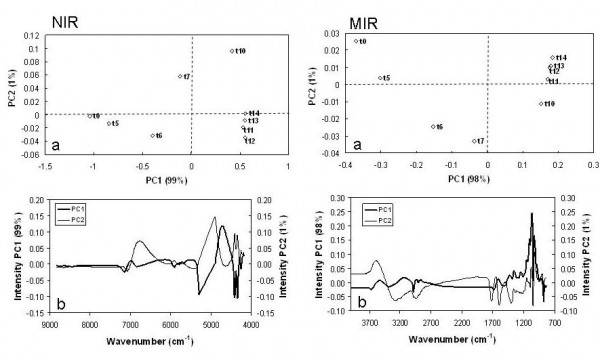
NIR and MIR spectroscopy were applied to investigate molecular changes and the PCA-score plots showed a satisfactory distribution of the samples in the area defined by the first two principal components according to the fermentation time for each micro-fermentation trial (Figure 2). The intensity loadings put in evidence that the main wavenumbers responsible for the separation of the samples were associated with the combination band of C-H (4454-4250 cm-1) related to carbohydrates in the near region, and with the C-O and C-C bonds (1087-1045 cm-1) of ethanol and carbohydrates in the medium region12.


FIGURE 2 Principal Component Analysis on NIR and MIR spectra: score plot (a) and loading plot (b) of a micro-fermentation trial in the plane defined by the first two principal components
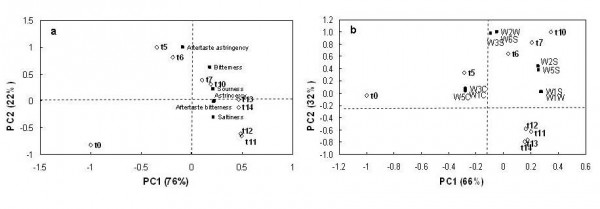
Electronic tongue and electronic nose were applied to evaluate the evolution of taste and aroma profiles during fermentation. Figure 3 shows the PCA bi-plot of electronic tongue (a) and electronic nose (b) data. The taste evolution (Figure 3a) was evident along the first principal component; must-wine samples were distri – buted from right to left according to the fermentation time. At the beginning of the process, the t0 sample was characterised by a poor taste (i.e. low ‘taste values’ calculated by sensors output); during fermentation (t5-t10) the taste evolved and samples were discriminated by the aftertaste astringency. At the end of fermentation (t11-t14), wine samples were perceived as more bitter and astringent and were also characterised by saltiness and sourness.


FIGURE 3Principal Component Analysis on electronic tongue (a) and electronic nose (b) data: bi-plot of a micro-fermentation trial in the plane defined by the first two principal components
The bi-plot of electronic nose data (Figure 3b) shows that must-wine samples were distributed along PC1 and PC2 according to fermentation time and the main fermentation stages were evidenced.
For the classification analysis, all the samples collected during the 2009 micro-fermentation trials were divided into three stages on the basis of metabolite concentrations: Class 1 – beginning of fermentation, Class 2 – high rate of fermentation, Class 3 – end of fermentation. Linear Discriminant Analysis (LDA) and Quadratic Discriminant Analysis (QDA) were applied to spectral data and to electronic nose and tongue data in order to distinguish the three fermentation stages. LDA and QDA were carried out on the entire set of variables and on optimal subsets of variables selected by means of Genetic Algorithms. Classification models were evaluated on the basis of the percentage of correctly classified samples (NER%) in fitting and in cross validation with 10 evaluation groups.
Table 2 reports the characteristics of the classification models selected as the best (highest values of NER% in cross validation); the variables involved in each model are also reported in the table.
Table 2 Characteristics of the classification models
|
Applied method |
Model |
Model size |
NER fitting (%) |
NER cross validation (%)
|
Model variables |
|
E-nose |
GA-QDA |
5 |
79 |
76 |
W5C, W1W, W1S, W3S, W1C |
|
|
|
|
|
|
|
|
E-tongue |
GA-LDA |
2 |
86 |
84 |
Astringency, Bitterness |
|
|
|
|
|
|
|
|
NIR |
GA-PCA-QDA |
6 ranges |
95 |
93 |
5939.9-5905.2; 4485.8-4451.1; 4408.7-4373.9; 4370.1-4335.4; 4331.5-4296.8; 4254.4-4219.7 |
|
|
|
|
|
|
|
|
MIR |
GA-PCA-QDA |
4 ranges |
91 |
91 |
2989.6-2970.3; 1396.4-1377.1; 1257.5-1238.3; 1188.1-1168.8 |
|
|
|
|
|
|
For NIR and MIR spectroscopy, QDA models are characterised by a high percentage of correct classification in validation (93 per cent and 91 per cent, respectively) showing that the spectroscopic techniques are able to predict the fermentation stages in agreement with the evolution of chemical parameters. The LDA model selected for the electronic tongue has an acceptable accuracy (84 per cent of correct classification in validation), showing that the taste is an important parameter to define the state of the fermentation process and the quality of the final product. Furthermore, the model is only composed of two variables, astringency and bitterness, useful to predict the fermentation stage of must-wine samples in a rapid and simple way and to give important information about the taste evolution. The QDA model selected for the electronic nose had the lowest percentage of correct classification (76 per cent); this technique is probably the least suitable to predict the fermentation stages even if it gives important information about the evolution of the aroma profile and consequently about the quality of wine.
The NIR and MIR spectral data collected during the 2008 and 2009 vintages were correlated with carbohydrate concentrations (glucose and fructose), fermentation products (ethanol and glycerol) and phenolic compounds (total polyphenols, total anthocyanins and total flavonoids) using Partial Least Squares (PLS) regression algorithm. Good calibration models to predict the main parameters involved in alcoholic fermentation (carbohydrates and alcohols) were obtained in both near and mid infrared regions. In particular, the models developed in the near infrared region (Table 3) performed well in the prediction of glucose (RMSECV=3.70 g L-1), fructose (RMSECV=4.46 g L-1), ethanol (RMSECV= 2.15 g L-1) and glycerol (RMSECV=0.46 g L-1). Good predictive models with a rcv>0.93 were also obtained for phenolic compounds. The models developed in the medium infrared region also proved to be well correlated with the chemical parameters. In particular, the MIR models were characterised by rcv values of 0.99 and RMSECV of 0.53 g L-1, 2.58 g L-1, 3.70 g L-1 and 2.33 g L-1 for glucose, fructose, ethanol and glycerol, respectively. Good results (rcv > 0.91) were also obtained for the prediction of total phenolics, total anthocyanins and total flavonoids.
Table 3 Statistical parameters for the prediction of sugars, alcohols and phenolic compounds in must-wine samples using FT-NIR spectroscopy.
|
Dependent Variable |
Data- pretreatment |
N° Latent Variable |
Calibration |
Cross-validation |
||
|
rcal |
RMSEC |
rcv |
RMSECV |
|||
| Glucose (g L-1) |
SNV-d2 |
5 |
0.99 |
3.44 |
0.99 |
3.70 |
| Fructose (g L-1) |
SNV |
3 |
0.99 |
4.37 |
0.99 |
4.46 |
| Ethanol (g L-1) |
MSC-d2 |
1 |
0.99 |
2.14 |
0.99 |
2.15 |
| Glycerol (g L-1) |
MSC-d2 |
5 |
0.99 |
0.44 |
0.99 |
0.46 |
| Total phenolics (g L-1) |
MSC-d1 |
6 |
0.96 |
185.1 |
0.95 |
208.7 |
| Total anthocyanins (g L-1) |
MSC-d1 |
10 |
0.95 |
17.5 |
0.93 |
20.4 |
| Total flavonoids (g L-1) |
MSC-d1 |
6 |
0.98 |
123.7 |
0.97 |
139.9 |
In conclusion, the results of this work demonstrate the feasibility of NIR and MIR spectroscopy to investigate molecular changes involved in must-wine fermentation and the possibility to apply the electronic nose and tongue in order to detect the evolution of aroma and taste profile during the process. Moreover, the ability of spectroscopic methods, electronic nose and electronic tongue, combined with GA and LDA or QDA, to classify samples on the basis of their fermentation stage was examined. Although in this study the measurements were carried out in off-line mode, sensors or probes could be implemented in future works to allow the process to be monitored on-line, giving real signals which relate to the development of the process and to the quality of the final product.
Acknowledgments
Part of this work has been presented at ‘2011 CIGR Section VI International Symposium’ Nantes, France – April 2011.
References
1. Peris, M. and Escuder-Gilabert, L., 2010. A 21st century technique for food control: Electronic noses. Analytica Chimica Acta, 638, 1–15
2. Kobayashi, Y., Habara, M., Ikezazki, H., Chen, R., Naito, Y. and Toko, K., 2010. Advanced taste sensors based on artificial lipid with global selectivity to basic taste qualities and high correlation to sensory scores. Sensors, 9, 3411-3443
3. Escuder-Gilabert, L. and Peris, M., 2010. Review: Highlights in recent applications of electronic tongues in food analysis. Analytica Chimica Acta, 665, 15–25
4. Fagan, C. C. and O’Donnell, C. P., 2008. Application of Mid-infrared Spectroscopy to food processing system. in Nondestructive Testing of Food quality, pp. 119-142 J. Irudayaraj, C. Reh. eds
5. Di Egidio, V., Sinelli, N., Giovanelli, G., Moles, A. and Casiraghi, E., 2010. NIR and MIR spectroscopy as rapid methods to monitor red wine fermentation. European Food Research Technology, 230, 947-955
6. Buratti, S., Benedetti, S., Scampicchio M. and Pangerod, E.C., 2004. Characterization and classifica – tion of Italian Barbera wines by using an electronic nose and an amperometric electronic tongue. Analytica Chimica Acta, 525, 133–139
7. Zwietering,M. H., de Koos, J. T., Hasenack, B. E., de Wit, J. C and van’t Riet, K., 1991. Modelling of bacterial growth as a function of temperature. Applied and Environmental Microbiology, 57, 1094-1101
8. Beebe, K. R., Pell, R. J. and Seasholtz, M. B., 1998. Chemometrics, a practical guide. New York, USA: John Wiley and Sons
9. McLachlan G., 1992. Discriminant Analysis and Statistical Pattern Recognition, New York, USA: John Wiley and Sons
10. Leardi, R. and Lupianez, A., 1998. Genetic algorithms applied to feature selection in PLS regression: how and when to use them. Chemometrics and Intelligent Laboratory Systems, 41, 195-207
11. Williams, P. and Norris, K., 2002. Near-Infrared Technology in the Agricultural and Food Industries. Vol. 2. American Association of Cereal Chemist, St. Paul, MN, USA.
12. Workman, J. and Weyer, L., 2008. Practical Guide to Interpretative Near-Infrared Spectroscopy. Boca Raton, FL, CRC Press, Taylor and Francis Group
Biography
Gabriella Giovanelli has a degree in Food Science and Technology. She is an Associated Professor at the Department of Food Science and Microbiology of the University of Milan. Her main research activity concerns modelling of food unit operations, antioxidant activity of food, shelf-life studies, implementation of quality and safety management systems in the food sector and in particular in the catering industry.
Susanna Buratti has a degree in Food Science and Technology and a PhD in Food Biotechnology. She is a research scientist at the Department of Food Science and Microbiology of the University of Milan. Her research activity concerns the quality control and the characterisation of foodstuff by using innovative and non destructive techniques such as the electronic nose, electronic tongue and image analysis. [email protected]


