New technique to identify prion diseases
- Like
- Digg
- Del
- Tumblr
- VKontakte
- Buffer
- Love This
- Odnoklassniki
- Meneame
- Blogger
- Amazon
- Yahoo Mail
- Gmail
- AOL
- Newsvine
- HackerNews
- Evernote
- MySpace
- Mail.ru
- Viadeo
- Line
- Comments
- Yummly
- SMS
- Viber
- Telegram
- Subscribe
- Skype
- Facebook Messenger
- Kakao
- LiveJournal
- Yammer
- Edgar
- Fintel
- Mix
- Instapaper
- Copy Link
Posted: 31 January 2005 | Peter Lasch and Heinz Fabian, Scientists, Robert Koch-Institute, Dieter Naumann and Michael Beekes, Group Leaders, Robert Koch-Institute, Jürgen Schmitt, Thomas Udelhoven and Michael Eiden, Synthon KG | No comments yet
A new technique for the detection of transmissible spongiform encephalopathies, such as scrapie in sheep or BSE in cattle, is based on IR (infrared) spectroscopy of serum and subsequent spectral analysis by advanced pattern recognition techniques.
Within the scope of two validation studies, IR spectra from sera of scrapie-infected Syrian hamsters and BSE-infected cattle were recorded. These, in addition to spectra from control animals, were evaluated by sophisticated computer based classifiers (artificial neural networks, ANN). A complex pattern of spectral features across a wide spectral range was obtained that permitted differentiation between TSE positive and control animals. These features, though not directly associated with the presence of the prion protein, could be useful in the future for an objective and automated ante mortem IR test for TSEs.
A new technique for the detection of transmissible spongiform encephalopathies, such as scrapie in sheep or BSE in cattle, is based on IR (infrared) spectroscopy of serum and subsequent spectral analysis by advanced pattern recognition techniques. Within the scope of two validation studies, IR spectra from sera of scrapie-infected Syrian hamsters and BSE-infected cattle were recorded. These, in addition to spectra from control animals, were evaluated by sophisticated computer based classifiers (artificial neural networks, ANN). A complex pattern of spectral features across a wide spectral range was obtained that permitted differentiation between TSE positive and control animals. These features, though not directly associated with the presence of the prion protein, could be useful in the future for an objective and automated ante mortem IR test for TSEs.
A new technique for the detection of transmissible spongiform encephalopathies, such as scrapie in sheep or BSE in cattle, is based on IR (infrared) spectroscopy of serum and subsequent spectral analysis by advanced pattern recognition techniques.
Within the scope of two validation studies, IR spectra from sera of scrapie-infected Syrian hamsters and BSE-infected cattle were recorded. These, in addition to spectra from control animals, were evaluated by sophisticated computer based classifiers (artificial neural networks, ANN). A complex pattern of spectral features across a wide spectral range was obtained that permitted differentiation between TSE positive and control animals. These features, though not directly associated with the presence of the prion protein, could be useful in the future for an objective and automated ante mortem IR test for TSEs.
Transmissible spongiform encephalopathies such as scrapie in sheep, bovine spongiform encephalopathy (BSE) in cattle, or the new variant of Creutzfeldt-Jakob disease (vCJD) in humans are a group of fatal neurodegenerative disorders characterised by misfolding and accumulation of the so-called ‘prion-protein’ (PrPsc) in the central nervous system (CNS). Since transmission of TSE constitutes a considerable threat to human health, the testing of CNS material from slaughtered cattle for the presence of the pathological prion protein, PrPsc, has been established as a routine procedure for TSE diagnosis. However, the development of rapid and reliable diagnostic screening methods, which permit ante mortem identification of TSEs, remains a matter of paramount scientific, economic and public health importance.
In this paper we report on the results of two validation studies demonstrating the suitability of Fourier transform infrared (FT-IR) spectroscopy and multivariate spectra analysis for ante mortem diagnosis of TSEs. Fourier transform infrared (FT-IR) spectroscopy uses infrared radiation to detect molecular chemistry and has become a useful non-destructive and reagent-free tool in analytical chemistry, material science, biology and medicine. Infrared spectra acquired on clinical samples from animals or humans are highly characteristic, fingerprint-like spectral signatures, which originate from the superposition of a vast number of various biomolecules in the samples. For a number of disease processes it is found that the composition of the sample constituents is slightly, but characteristically, altered. The disease-specific alterations can be revealed by IR spectroscopy and utilised for diagnosis of diseases by advanced methods of multivariate data analysis.
Materials and methods
Serum samples
Within the scope of an experimental scrapie study, Syrian hamsters were infected via different routes of infections (orally, intracerebrally, intraperitoneally). All infected animals were sacrificed at the terminal stage of scrapie. Mock-infected control animals were sacrificed on the same day (see reference 1 for details).
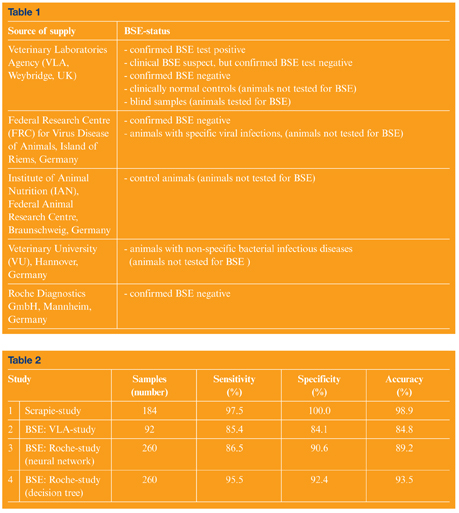
Serum samples from cattle were obtained from the Veterinary Laboratories Agency (VLA, Weybridge, UK) and from different sources in Germany. An overview of sample origins, sample numbers and sample characterisations is given in Table 1.
IR spectroscopy
For IR spectroscopy 2.6µl of serum were transferred onto one of the 15 sample positions of an IR multicuvette. After drying, the IR measurements were carried out on an IFS 28/B spectrophotometer (Bruker Optics GmbH, Ettlingen) in transmission/absorbance mode. Each sample was measured in triplicate, i.e. at three different times. Further details are described in references 1 and 2.
Data analysis
Analysis of spectral data was based on supervised classification tools such as artificial neural networks (ANN software: NeuroDeveloper, Synthon GmbH, Heidelberg) or a combination of spectral feature selection and linear discriminant analysis (LDA). This strategy of data evaluation required teaching and optimisation (e.g. by internal validation) of classifiers. When the teaching process was finished, the classifier could be subsequently challenged by an external (blinded) validation data set. Thus, in both validation studies data was split into subsets for teaching, internal and external validation. It is important to note that external validation subsets were kept totally separate from the teaching procedure until the final validation had been performed. Furthermore, spectra of the three independent measurements on each sample were always grouped such that they appeared in only one of the respective subsets. After unblinding of diagnoses, classification results of the reference methods (immunocytochemistry, pathohistology) were correlated with results of the IR methodology and numbers of the classification accuracy, sensitivity and specificity were obtained.
Adequate data pre-treatment turned out to be an essential prerequisite for multivariate data analysis. Thus, prior classification spectra had to be converted to second derivatives and vector-normalised over the spectral range from 2820-2985cm-1. Data reduction was performed by averaging three adjacent data points and by removing the spectral information in the spectral windows, 500-700cm-1, 1500-1700cm-1, 1750-2800 and 3100-4000cm-1, respectively. Spectral features, i.e. spectral parameters representing the discriminative information, were then identified by automised methods of feature selection (for details see references 1 and 2). Overall, between 80 and 140 spectral features were used per sample spectrum by the ANNs.
Results and discussion
In the scrapie study infrared spectral data were evaluated by an optimised artificial neural network. This network had been trained and internally validated with spectra obtained from 128 hamsters. An overview of the classification results of the external (independent) validation subset can be found in row 1 of Table 2. As shown by the accuracy of 98.9%, only two of 184 hamsters were misclassified. Two scrapie-infected hamsters were classified by the FT-IR test as negatives (two false negatives, sensitivity: 97.5%), while all of the control animals could be identified according to their a priori class assignment (0 false positives, specificity of 100%). These results suggested that a scrapie-associated serum marker could be identified to diagnose scrapie in the terminal stage of the disease1. The molecular identity of the serum marker components remains however, unknown.
The promising results of our scrapie study prompted us to evaluate the potential of the spectroscopy based methodology in two blinded BSE field studies. For this purpose, sera of BSE positive animals, which had been positively tested by histopathology and/or immunocytochemistry methods, were acquired from the Veterinary Laboratories Agency (VLA, Weybridge, UK). Sera from BSE negative controls were obtained from various origins in the UK and Germany and originated from healthy control animals, real controls (i.e. clinical suspect, but negative BSE test result) and from cattle suffering from viral or bacterial infectious diseases (see Table 1).
In this article we present the results of two distinct BSE studies. These studies differ in the number of cattle examined as well as in the methods of data analysis. The first study (‘VLA study’) was carried out in cooperation with the VLA and included blind validation of sera from 92 cattle. In the second study (‘Roche study’) we received sera from 260 animals for blind validation from Roche Diagnostics GmbH.
Within the scope of the Roche study we also tested new concepts of data analysis. Data from the Roche study was evaluated by a single ANN, but also by a combined so-called ‘metaclassifier’. This special classifier was represented by a decision tree, which combined diagnoses of ANNs – each optimised for either high sensitivity or high specificity – as well as LDA-based classifiers (see last line of Table 2 for results and Reference 2 for details).
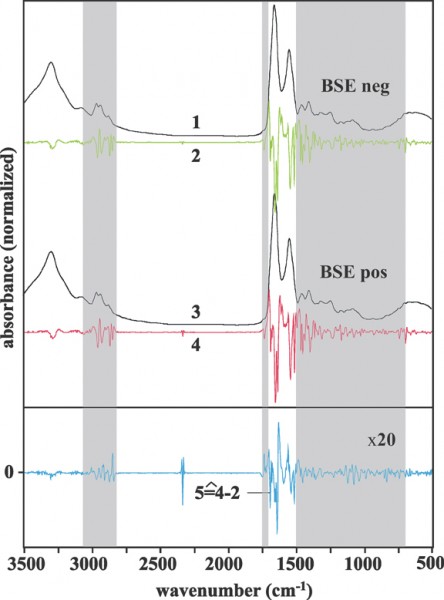
In consequence, the classification accuracy correlated with the number of samples used for training and validation. Furthermore, we have noted a higher robustness and a higher classification accuracy of the combined classifier (decision tree, cf. rows 3 and 4 of Table 2). The results of both BSE studies confirmed our previous conclusions from the scrapie study: in the terminal stage of a TSE disease FT-IR spectroscopy identifies TSE-specific serum marker compounds. These markers can be detected and utilised for disease diagnosis by advanced methods of multivariate data analysis. Figure 1 clearly demonstrates infrared spectral differences between sera from BSE positive and control animals. As shown, spectral differences were found in almost the entire spectral range. This finding clearly indicates that the IR method is not based on one unique serum marker alone. It seems more plausible that the concentration of a plurality of serum constituents is slightly changed, as suggested by the complex spectral difference pattern shown in trace 5 of Figure 1. Thus the new technique is based on a number of, as yet unidentified, surrogate markers rather than on the pathological prion protein. The identification of the diagnostic marker compounds should be carried out by sensitive and molecule-specific analytical techniques, such as various mass or NMR spectroscopies (GC-MS, HPLC-MS). We have great confidence that the use of metabolomic and/or proteomic approaches is the way forward to identify TSE specific surrogate markers from blood or its components.
Summary
A combination of FT-IR spectroscopy and advanced methods of multivariate pattern analysis techniques could be successfully employed to identify TSEs from serum samples in the terminal stage of the disease. In an experimental scrapie study a sensitivity of 97% and a specificity of 100% could be achieved. Furthermore, in the context of an ante mortem BSE field study we attained classification results up to 96% (sensitivity) and 92% (specificity). Although promising, these results are still unsatisfactory for BSE screening in a practical environment. Thus, further improvements of the classification accuracy are required which could be achieved by enlarging the sample data base and by identifying TSE-specific structural and compositional alterations in the serum spectra. We are currently investigating the earliest time point after infection at which the IR methodology can detect spectral changes in serum.


Figure 1. Mean spectra obtained from FT-IR measurements of sera from BSE-positive and control cattle. Spectral subregions contributing significantly to the separation of BSE positive and control cattle are shown as grey boxes 1: normalised average spectrum from BSE-negative cattle 2: second derivative spectrum obtained from trace 1 3: normalised average spectrum from sera of BSE-positive cattle 4: second derivative spectrum obtained from trace 3 5: difference spectrum between traces 4 and 2 (positive - negative, magnified by a factor of 20)


