


Fermented beverages are shaped by more than yeast, grain, grapes or rice. Their amino-acid fingerprints record microbial activity, processing and maturation, yet the D/L balance remains difficult to measure. A practical UHPLC workflow makes that hidden chemistry easier to read.
When producers talk about amino acids, the conversation usually focuses on total nitrogen, free amino nitrogen or the L-isomers used in protein synthesis. But amino acids are chiral: D- and L-forms share the same formula while differing in three-dimensional arrangement. That difference can affect how molecules interact with taste receptors, enzymes and microorganisms.
In fermented foods and drinks, D-amino acids may arise through microbial metabolism, racemization, raw-material chemistry or processing conditions. They are therefore not automatically contaminants, or proof of quality on their own. Their value is contextual. A D/L profile can add another layer to questions that breweries, wineries and distilleries already ask: How consistent is fermentation? Did a process change alter the product’s chemical fingerprint? Can products be differentiated by style, origin or treatment?
This broader perspective is consistent with food-chemistry reviews by Milton Friedman and later overviews by Genchi, which treat D-amino acids as biologically relevant components whose significance depends on identity, concentration and matrix.2,3 For product developers, the opportunity is to connect stereoisomer composition with sensory, process and quality data rather than evaluate any single compound in isolation.
As D-amino acids are often present at trace levels alongside much larger amounts of L-amino acids, their detection in a complex beverage matrix, can be challenging. A method may detect a D-isomer in a clean standard but struggle when sugars, acids, polyphenols, salts and fermentation by-products compete in a real sample.
While LC-MS can provide powerful structural information and high sensitivity, matrix effects and ion suppression may complicate quantitative work. Manual pre-column derivatization introduces another risk: the reaction clock starts as soon as reagents are mixed, while the product can begin to degrade before injection.
For an industrial laboratory, this is a familiar pain point. The best method is not necessarily the one with the most sophisticated detector; it is the one that delivers defensible data repeatedly, with a workflow analysts can execute at scale. Therefore we present a straightforward UHPLC method with automated derivatization and fluorescence detection for highly sensitive analysis of 37 D/L-Amino acids applied to liquor profiling.
Sample preparation and analytical method
N-isobutyryl-L-cysteine (NIBC) is combined with o-phthalaldehyde (OPA) to create fluorescent diastereomers from D/L amino acids. Because the D- and L-forms become different reaction products, they can be separated by reversed-phase UHPLC and measured by fluorescence detection.
The workflow targets 37 D/L amino acids and uses a small-particle C18 column, a programmed gradient and fluorescence detection. Crucially, it replaces two derivatizing reagents and two separations with a single chiral derivatizing reagent and a consolidated analysis as shown in table 1.
|
System: |
Nexera UHPLC system (Shimadzu, Japan) |
|
Column: |
L-column 3 C18 (150 mm × 2.1 mm I.D., 2.0 µm) (CERI, Japan) |
|
Flow rate: |
0.22 ml/min |
|
Gradient: |
A) 10 mmol/L sodium phosphate buffer (pH 6.9) B) Acetonitrile/Methanol (15:85 v/v) from 8 %B to 80 %B in a 7-step gradient over 75 min, 12 min re-equilibration at 8 %B |
|
Column temperature: |
20 °C |
|
Injection volume: |
1 µl |
|
Detection: |
Fluorescence detection, Ex: 338 nm, Em: 455 nm (semimicro cell) |
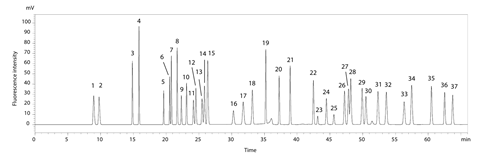
The mixed-standard chromatogram (figure 1) shows separation of all 37 target compounds listed in table 2 in approximately 66 minutes. Calibration was linear across compound-specific ranges (table 2), with every coefficient of determination at or above 0.999. In six repeated analyses, peak-area repeatability was 1.6 percent RSD or better at 0.1 µmol/L and 0.8 percent RSD or better at 5 µmol/L.
No. |
Compound |
Conc. Range (µmol/L) |
No. |
Compound |
Conc. Range (µmol/L) |
|
1 |
L-Aspartic acid |
0.5-50 |
20 |
L-Tyrosine |
1-50 |
|
2 |
D-Aspartic acid |
0.01-2 |
21 |
D-Tyrosine |
0.01-2 |
|
3 |
L-Glutamic acid |
1-50 |
22 |
L-Valine |
1-50 |
|
4 |
D-Glutamic acid |
0.01-2 |
23 |
L-Cystine (L,L-cystine) |
0.05-10 |
|
5 |
L-Asparagine |
0.5-50 |
24 |
L-Methionine |
0.01-5 |
|
6 |
D-Asparagine |
0.05-5 |
25 |
D-Cystine (D,D-cystine) |
0.02-2 |
|
7 |
L-Serine |
0.2-50 |
26 |
L-Tryptophan |
0.5-50 |
|
8 |
D-Serine |
0.01-5 |
27 |
D-Methionine |
0.01-5 |
|
9 |
L-Glutamine |
1-50 |
28 |
D-Valine |
0.01-2 |
|
10 |
D-Glutamine |
0.1-5 |
29 |
L-Isoleucine |
0.2-50 |
|
11 |
L-Histidine |
1-50 |
30 |
L-Phenylalanine |
1-50 |
|
12 |
L-Threonine |
1-50 |
31 |
D-Tryptophan |
0.01-2 |
|
13 |
D-Histidine |
0.1-10 |
32 |
D-Phenylalanine |
0.01-1 |
|
14 |
D-Threonine |
0.01-5 |
33 |
L-Leucine |
1-50 |
|
15 |
Glycine |
1-50 |
34 |
D-Isoleucine |
0.01-2 |
|
16 |
L-Arginine |
1-50 |
35 |
D-Leucine |
0.01-2 |
|
17 |
D-Arginine |
0.01-2 |
36 |
L-Lysine |
0.5-50 |
|
18 |
L-Alanine |
1-50 |
37 |
D-Lysine |
0.01-2 |
|
19 |
D-Alanine |
0.01-5 |
Automation addresses the most fragile step. Mobile-phase blending reduces manual solvent preparation, while the autosampler performs derivatization within the injection needle and transfers the reaction product directly to the column. Keeping the derivatization-to-injection interval constant is more than a convenience: it is a core control strategy for reproducibility. For a 20-sample sequence, it requires 15 minutes of preparation time for the automated workflow compared to approximately 70 minutes required for manual operations.1
Quantitative analysis in liquor samples
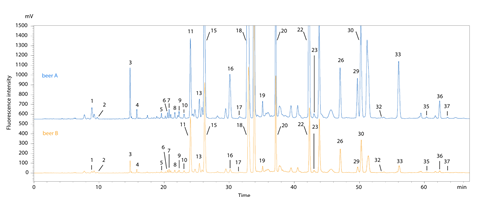
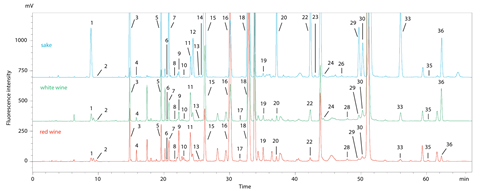
The method was applied to beer, sake, red and white wine samples after dilution and 0.2 µm membrane filtration. Between 25 and 28 amino acids were detected in five different beverages, as shown in figure 2. The total D-amino-acid fraction was 6 percent or less in each sample, but the aggregate value did not tell the whole story. Individual stereoisomer ratios varied substantially: for example, the reported D fraction for asparagine was 43.6 percent in Beer A and 53.1 percent in Beer B, while several amino acids also showed elevated D fractions in wine.
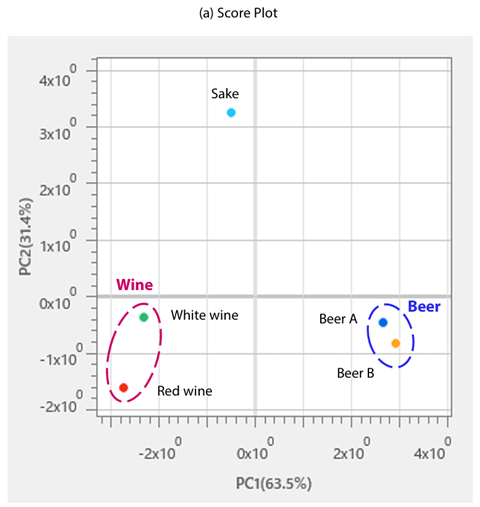
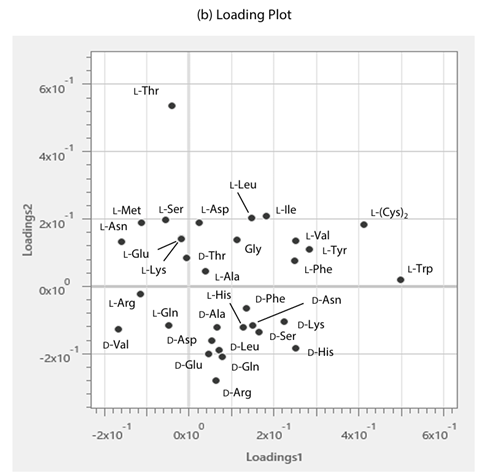
That distinction matters. A total D/L number can be useful for benchmarking, but marker-level patterns may be more informative for troubleshooting or classification. Principal component analysis (PCA) using the statistical analysis software eMSTAT Solution (Shimadzu) illustrated the point. In the score plot (figure 3 a) Beer A and Beer B clustered together, as did red and white wine, while sake was separated from the other beverages. The loading plot (figure 3 b) associated L-Tryptophan, D-Histidine and D-Lysine with beer, D-Valine with wine and L-Threonine with sake. These are not universal “fingerprints” for every brand or region, but they are proof that stereoisomer-resolved data can reveal patterns that total amino-acid measurements may hide.
Practical implementation
Laboratories considering D/L amino-acid profiling should treat sample preparation and data interpretation as part of the method, not as afterthoughts:
- Standardize dilution, filtration, temperature and holding time. The application used ten-fold dilution in 10 mmol/L hydrochloric acid for beer and wines, and twenty-fold dilution for sake.1
- Lock the reaction timeline. Record reagent preparation time, derivatization start and injection time; automate where possible.
- Respect calibration limits. The D- and L-isomers have different working ranges, and some L-amino acids in the liquor study were outside their quantitation ranges. Avoid extrapolation.
- Build matrix-aware quality control. Use mixed standards, blanks, replicate preparations and matrix spikes to separate instrument drift from sample effects.
- Combine chemistry with process knowledge. Interpret unusual D/L patterns alongside yeast or bacterial culture, fermentation temperature, raw materials, aging, filtration and sensory results.
- Use PCA for discovery, not overclaiming. Replicates improve confidence, but broader classification requires a larger, representative sample set and independent validation.
Conclusion
In this study a simple UHPLC method for the sensitive, accurate, and precise simultaneous separation of 37 D/L-amino acids using OPA/NIBC derivatization was developed, considerably reducing analysis time compared to conventional methods. This approach provided good separation in real liquor samples and offers a practical alternative to more expensive LC-MS methods for D/L-amino acid profiling in food and beverage samples.
With automated derivatization, controlled timing, fluorescence sensitivity and multivariate analysis, using this method, a laboratory can move from “D-amino acids are present” to more useful questions about consistency, process impact and product differentiation.
For laboratories that need broad coverage without the cost or complexity of MS or multidimensional LC, this UHPLC workflow offers a natural platform. More importantly, it shows a direction for the industry: make high-value measurements easier to repeat, easier to interpret, helping beverage scientists read the hidden stereochemical signature of fermentation.
References
- Iwata N. UHPLC Method for Sensitive Automatic Analysis of Thirty-Seven D/L-Amino Acids and for Liquor Profiling. Shimadzu Application News 01-01169-EN. First edition, June 2026.
- Friedman M. Chemistry, nutrition, and microbiology of D-amino acids. Journal of Agricultural and Food Chemistry. 1999;47(9):3457–3479.
- Genchi G. An overview on D-amino acids. Amino Acids. 2017;49:1521–1533.
- Iwata N, Watabe Y, Horie S, Hayakawa Y. Chromatography. 2021;42:133–141.
- Iwata N, Kobayashi M. Chromatography. 2024;45:63–72.