



In manufacturing environments, testing for product quality is vital. Products must be tested not only to ensure batch-to-batch consistency, but to confirm no contaminants are present. Contaminants could have a minor effect like causing a change in the appearance of a material, or in some cases they could cause more troublesome issues like the formation of unwanted side products. These possible alternative reactions may lead to formation of an inactive substance or generate harmful byproducts. Quality checks for these possible product defects are commonplace and can be executed through a variety of different analytical techniques.
For some solution-phase products, substances included in a product can be measured using UV-Visible absorption spectroscopy, a non-destructive analytical technique. Analytes measured can include flavor additives, dyes, and other components (e.g., caffeine). In this method, ultraviolet or visible light interacts with a sample, and the sample can transmit the light or absorb it. The range of wavelengths which can be absorbed by the sample comprise the absorption spectrum, a characteristic trait of the analyte(s) of interest. As absorption arises from electronic transitions specific to the studied analyte, the resulting spectrum will be unique to the substance studied.
The absorbance of a compound at a given wavelength can be related to concentration through Beer’s law (eqn. 1),
A = clε
Equation 1
Where A is the measured absorbance, l is the path length of the cuvette used, ε is the molar extinction coefficient (a property unique to the analyzed compound), and c is concentration. As shown in this equation, absorbance is linearly proportional to the analyte concentration. Through this relationship, UV-Visible spectroscopy can be used to not only identify the presence of a given analyte, but to determine its concentration as well. While not all molecules absorb in the UV-Visible range, those that do can be easily measured and further quantified through this technique. As UV-Visible spectroscopy is non-destructive, the sample can be retrieved post-analysis for further testing or down-stream processing.
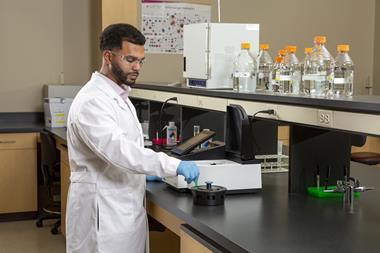
Herein, the custom method application in the local control software of the Thermo Scientific™ GENESYS™ G5 Vis Spectrophotometer was used to analyze a set of sports drink samples as an example of product quality checks. These experiments demonstrate a scenario in which two different products are manufactured in the same facility. Using the UV-Visible spectra of the drinks as standards, equations were generated to identify if the concentration of a given sample was within an acceptable range as well as determine if one product contaminated the other. These results demonstrate the utility of the custom method application for assessing product quality and providing quick pass/fail assessments.
Experimental
Two different sports drinks, green apple flavored (“GA”) and strawberry lemonade flavored (“SL”), were acquired from a local supermarket and used as received for all samples and standards made herein. Standard GA and SL solutions were made in triplicate. Each standard solution was prepared by diluting the respective stock solution with DI water, resulting in a final concentration reported in % v/v GA or % v/v SL. The absorption spectrum of three 20% v/v GA and three 20% SL solutions were measured using the GENESYS G5 Vis spectrophotometer from 350 nm to 700 nm. The scans were collected using a slow scan speed and a 1.0 nm data interval.
A standard curve was generated using solutions of 4%, 10%, 20%, 30% and 40% v/v GA in water in order to determine the extinction coefficient (ε, units: %-1 cm-1). The spectra were collected using the scan application on the GENESYS G5 Vis Spectrophotometer. Specifically, the absorbances at 425 nm and 630 nm were monitored and used for the standard curve analysis. The absorption spectra were collected between 350 nm and 700 nm using a slow scan speed and 1.0 nm data interval, similar to previous measurements. Each standard was analyzed in triplicate.
Four samples were made using the appropriate stock sports drink and DI water to be analyzed using the developed custom method. The amount of each component included in each sample is described in Table 1.
| Sample | Volume GA stock (mL) | Volume water (mL) | Volume SL stock (μL) |
|---|---|---|---|
|
GA-1 |
0.50 |
2.00 |
— |
|
GA-2 |
0.25 |
2.25 |
— |
|
GA-3 |
0.50 |
1.95 |
50 |
|
SL-1 |
— |
2.00 |
500 |
Table 1. Solution volumes used to prepare each sample analyzed using the Sports Drink – GA custom method.
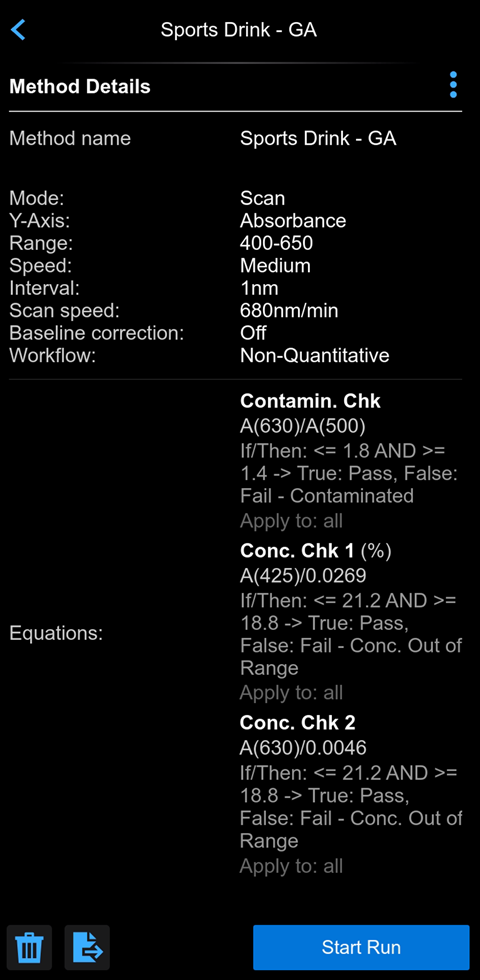
The custom method, labeled Sports Drink – GA, was generated using the custom method application included in the local control software (Figure 1). Three equations with pass/fail criteria were established – one (Contamin. Chk) to identify if a contaminant was present in the sample and two (Conc. Chk 1, Conc Chk 2) to check for sample concentration (see Table 2). The results from the standard curve measurements were used to estimate ε at 425 nm and 630 nm, which were included in the Conc. Chk. 1 and Conc. Chk. 2 equations, respectively.The Sports Drink – GA method was then used to analyze all samples described previously. Each sample was analyzed using a 1.0 cm glass cuvette.
| Equation name | Equation | Pass/fail criteria |
|---|---|---|
|
Contamin. Chk. |
A(630)/A(500) |
1.4 ≤ A(630)/A(500) ≤ 1.8 |
|
Conc. Chk. 1 |
A(425)/0.0269 |
18.8% ≤ A(425)/0.0269 ≤ 21.2% |
|
Conc. Chk. 2 |
A(630)/0.0046 |
18.8% ≤ A(630)/0.0046 ≤ 21.2% |
Table 2. Equations generated using the custom method application
Results/discussion
Setting acceptance criteria
To demonstrate a possible quality check, a method was developed to check the concentration of GA, a sports drink, and determine if a contaminant, SL sports drink, is present. This scenario mimics a possible manufacturing environment in which more than one product is handled using either the same equipment or in close proximity to one another. It is important to note that there are a variety of substances which can be analyzed using UV-Visible techniques, such as caffeine or flavorings, which are not related to the color of the sample. For the purposes of this experiment, only absorption features related to the dyes used in the studied beverages are analyzed.
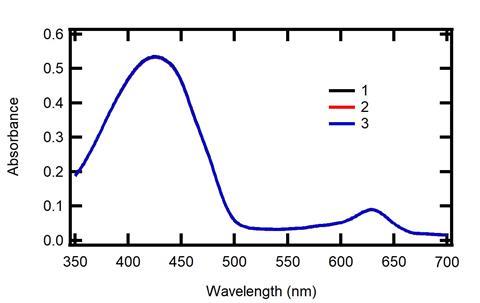
In order to develop this method, the spectra of 20% v/v GA, referred to as the GA standard, were collected in triplicate. From the collected spectrum the absorption maxima were found at 630 nm and 425 nm. According to Beer’s law (eqn. 1), the absorbance is directly proportional to the concentration of the absorptive component in solution. Consequently, the absorbance at both of these absorption maxima (0.089 and 0.53 at 630 nm and 425 nm, respectively) was used as a standard value. However, more information is needed to create a pass/fail value in terms of GA concentration (units: %).
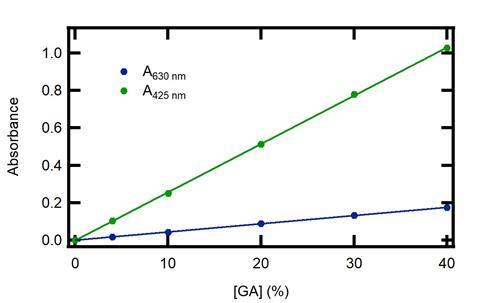
In order to convert the recorded absorbance to concentration, the extinction coefficient is required, as outlined through Beer’s law (eqn. 1). To determine the extinction coefficient, standard curves were generated using absorption measurements of GA samples with varying concentration as described in the Experimental section (Figure 2b). The extinction coefficient is then estimated using the slope of the line best fit to the data. From the standard curves using data collected at 425 nm and 630 nm, the extinction coefficients were found to be 0.0269 +/- 0.0001 %-1 cm-1 and 0.00458 +/- 0.00005 %-1 cm-1, respectively. Using these results, equations were created to convert the measured absorbance at 425 nm and 630 nm to concentrations values. The pass/fail criteria were then created to determine if the concentration was within acceptable limits. For the purposes of this experiment, the passing concentration range was selected to be 18.8% - 21.2%. A failed test will report “Fail – Conc. Out Of Range”.
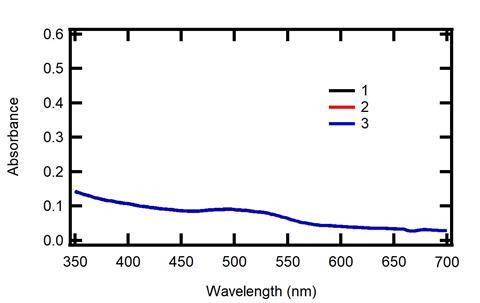
The spectra of 20% v/v SL (SL standard), a possible contaminant, were collected using the same instrument parameters to see if the absorption spectrum overlaps with the spectrum for GA. A broad absorption feature can be found between 475 nm and 550 nm as well as a baseline artifact extending throughout the spectrum, possibly from scatter (Figure 3). As GA has minimal absorption in the range containing an absorptive feature from SL, the absorbance collected at this range can be used to determine if the GA sample is contaminated with SL. For this experiment, a ratio between the absorbance at 630 nm, where GA absorbs, and 500 nm, where SL absorbs, is used to test if the GA sample is contaminated with SL (Table 2). A failed test will report “Fail – Contaminated”.
Analysis with Sports Drink - GA custom method
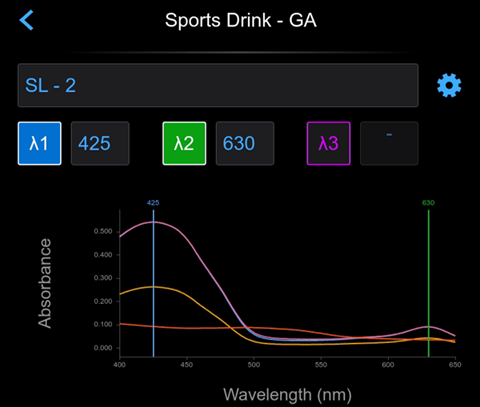
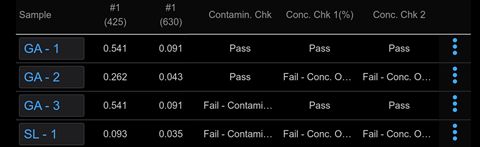
Four different samples were then used to test the established pass/fail criteria outlined in Table 2. First, the absorption spectrum for both the GA and SL standards were measured and checked against the generated acceptance criteria through the Sport Drink - GA custom method. As expected, the GA standard passed all tests while the SL standard failed all tests (Figure 4). This result indicates to the user that the sample at the least contains a contaminant and at most may also not be the correct concentration. This failure can then be used as an indicator that the sample or batch the sample came from should be further checked to ensure the correct substance was analyzed.
To simulate a scenario where the product was improperly mixed or diluted, a 10% v/v GA samples was prepared. When analyzed using the Sports Drink - GA custom method (Figure 4), both Conc. Chk 1 and Conc. Chk 2 failed, indicating the concentration was outside of the acceptable range as expected. However, note that though the concentration was incorrect, the ratio between the absorbance at 630 nm and 500 nm still passes, indicating no contaminant was present. As the ratio between these two numbers will remain the same regardless of the sample concentration, the user will be able to differentiate whether the error is strictly from the amount of analyte present, or if it arises from a contaminant. Note that if a contaminant does not absorb in the UV-Visible region this method cannot rule out the presence of a contaminant. Under these circumstances, an additional quality test should be administered.
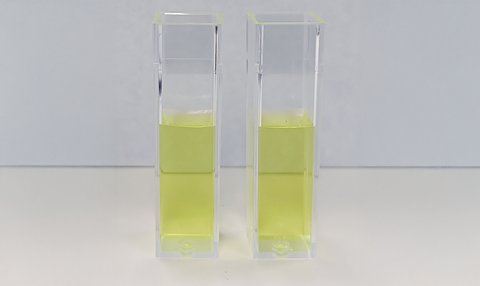
Finally, a sample was generated which intentionally included a contaminant, SL, that absorbs in the UV-Visible region. In solution, the amount of SL present was 2% v/v, an order of magnitude smaller than the concentration of GA (20% v/v). As can be seen in Figure 4a, by eye the standard GA without SL contamination appears the same as the contaminated GA sample. However, small variations can be observed in the UV-Visible spectrum (Figure 4a). When the equations are applied, the concentration of GA is shown to be in range, however the contaminant is detected as shown by the “Fail – Contaminated” result in Figure 4b.
Conclusion
As demonstrated in these experiments, UV-Visible absorption spectroscopy can be a useful tool for checking product quality. Through the custom method application, acceptance criteria can be set, allowing for a quick pass/fail check of a product based on the measured absorption spectrum. In the example described herein, equations were included which identified the presence of a possible contaminant as well as determined if the sample concentration was within the appropriate limits. While the analysis of samples with different colorants is used as an example herein, there are a wide variety of other solution phase compounds which can be checked for quality purposes using UV-Visible techniques.