InsideFood: 3-D sensors for food microstructure
- Like
- Digg
- Del
- Tumblr
- VKontakte
- Buffer
- Love This
- Odnoklassniki
- Meneame
- Blogger
- Amazon
- Yahoo Mail
- Gmail
- AOL
- Newsvine
- HackerNews
- Evernote
- MySpace
- Mail.ru
- Viadeo
- Line
- Comments
- Yummly
- SMS
- Viber
- Telegram
- Subscribe
- Skype
- Facebook Messenger
- Kakao
- LiveJournal
- Yammer
- Edgar
- Fintel
- Mix
- Instapaper
- Copy Link
Posted: 1 November 2011 | Pieter Verboven, BIOSYST-MeBioS, Katholieke Universiteit Leuven | No comments yet
EU FP7 project InsideFood (2009-2013) brings together leading experts in food science, sensor and information technology to the benefit of the food industry. To make significant advances in delivering foods with excellent quality, the role of microstructure and composition must be understood and used in the manufacturing process. This can only be achieved by accurate techniques that detect changes in the internal microstructure and composition. InsideFood, coordinated by Professor Bart Nicolaï of the Katholieke Universiteit Leuven, explicitly aims at measuring food microstructure, the spatial distribution of food components within foods, with state-of-the-art tomographic and spectroscopic measurement, and relating them to food quality attributes such as texture and mass transfer properties. In particular, 3-D sensors provide powerful spatial information on food microstructure. These 3-D techniques are essential to investigate the multiscale structure and properties of foods.
The consortium (Figure 1, page 50) combines experts in food technology and engineering with sensor specialists and IT specialists, involving a sensor SME (Skyscan), an IT SME (Visualisation Group Sciences) and a large sensor company (Bruker Biospin).
EU FP7 project InsideFood (2009-2013) brings together leading experts in food science, sensor and information technology to the benefit of the food industry. To make significant advances in delivering foods with excellent quality, the role of microstructure and composition must be understood and used in the manufacturing process. This can only be achieved by accurate techniques that detect changes in the internal microstructure and composition. InsideFood, coordinated by Professor Bart Nicolaï of the Katholieke Universiteit Leuven, explicitly aims at measuring food microstructure, the spatial distribution of food components within foods, with state-of-the-art tomographic and spectroscopic measurement, and relating them to food quality attributes such as texture and mass transfer properties. In particular, 3-D sensors provide powerful spatial information on food microstructure. These 3-D techniques are essential to investigate the multiscale structure and properties of foods. The consortium (Figure 1, page 50) combines experts in food technology and engineering with sensor specialists and IT specialists, involving a sensor SME (Skyscan), an IT SME (Visualisation Group Sciences) and a large sensor company (Bruker Biospin).
EU FP7 project InsideFood (2009-2013) brings together leading experts in food science, sensor and information technology to the benefit of the food industry. To make significant advances in delivering foods with excellent quality, the role of microstructure and composition must be understood and used in the manufacturing process. This can only be achieved by accurate techniques that detect changes in the internal microstructure and composition. InsideFood, coordinated by Professor Bart Nicolaï of the Katholieke Universiteit Leuven, explicitly aims at measuring food microstructure, the spatial distribution of food components within foods, with state-of-the-art tomographic and spectroscopic measurement, and relating them to food quality attributes such as texture and mass transfer properties. In particular, 3-D sensors provide powerful spatial information on food microstructure. These 3-D techniques are essential to investigate the multiscale structure and properties of foods.
The consortium (Figure 1) combines experts in food technology and engineering with sensor specialists and IT specialists, involving a sensor SME (Skyscan), an IT SME (Visualisation Group Sciences) and a large sensor company (Bruker Biospin).
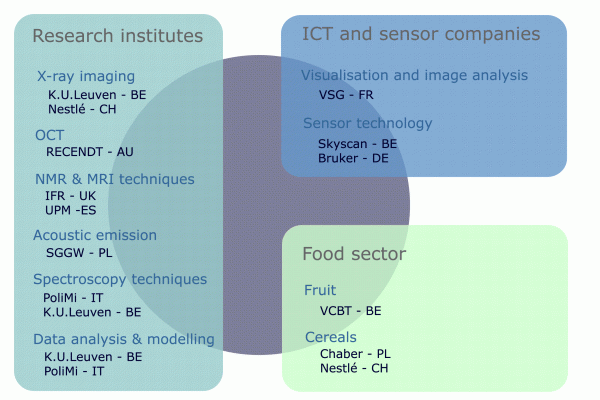

Figure 1 The InsideFood consortium joins researchers with technology providers and food companies
The research partners are the Katholieke Universiteit Leuven, the Institute of Food Research, the Politechnical University of Milan, the Research Centre for Nondestructive Testing, the Warsaw University of Life Sciences and the University of Madrid. The results are directly to the benefit of end-users, including two SMEs (the Flemish Centre of Postharvest Technology, VCBT, and a cereal product producer, Chaber) and one large food company (Nestlé). The techniques will be used to improve the nutritional quality (sugar and gluten-free cereal products), sensory quality (texture of all foods) and safety (foreign material detection in cereal products) of foods and prototypes are developed and applied to test cases.
Food microstructure
InsideFood aims at dedicated applications for gels, mousses, fruit and cereals within the project scope (Figure 2). We hope to develop spin-off activities for other segments of the food industry.
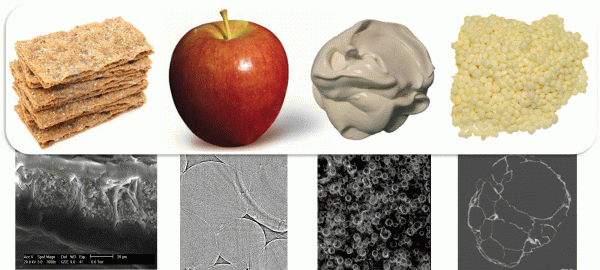

Figure 2 InsideFood considers foods with high importance to the European market and consumer, from left to right: crispy bread, apple, foam, breakfast cereals. Diagrams underneath the pictures are 2D pictures of the microstructure of the foods, highlighting the complex food structure that is essential three-dimensional with nano and microscale features.
The Product Technology Center (PTC) Orbe is part of Nestec, the scientific and technical arm of Nestlé SA, the world-leading food, health and wellbeing company.The main focus of Nestlé PTC Orbe is linked to powdered beverages (coffee, cocoa, malt) and cereal-based products. To ensure a high innovation rate, the main responsibility of Nestlé PTC Orbe is to create proprietary innovations for the entire company by applying cutting-edge scientific and technological means. Substantial efforts are devoted to the understanding of the relationship between texture design and product quality as affected by food processing in order to deliver new benefits to the consumers. Chaber Ltd is a producer of crisp bread and breakfast pillows in Poland since 1991 under the ownership of Konrad Banecki. Chaber cooperates with retailers in many countries in the world and produces private label products. The products of Chaber do not contain artificial ingredients. The company uses extrusion as modern technology for the production of dry breads. All recipes are prepared and examined by food technologists in the laboratory of the company. The relationship between formulation and processing versus the final quality of crisp bread is not well understood to date. This knowledge, however, is necessary for the design of new successful formulations and processes. The correlation of structure and texture of cereal products is crucial in quality control. During production and storage, many factors affect the quality of cereal products. There is a need to control texture on-line to reduce undesirable changes in structure (texture). The quantitative analysis of texture enables to keep and control high quality standards for cereal products.
The Flanders Centre of Postharvest Technology (VCBT) is a non-profit organisation, which was established in 1997 by the Katholieke Universiteit Leuven and the Association of Belgian Horticultural Auctions. The latter is the umbrella organisation for the Belgian horticultural sector and represents eight co-operative auctions and over 10,000 fruit and vegetable producers, mainly SMEs. The VCBT disseminates applicable research results to the horticultural industry for improving product quality. Internal disorders in fruit can cause extreme losses during the storage season. Since fruits normally have to be cut to detect internal disorders, they are often only observed upon quality inspection of the whole batch after shipping. This typically leads to refusal and subsequent destruction of the whole batch which may cause large financial losses. Using new microstructure sensors and with improved understanding of the effect of microstructure on the disorder, their occurrence may be detected earlier or even in advance, resulting in more high quality fruit on a European and worldwide scale.
Tomography provides 3-D visualisation of food microstructures
Tomography provides three-dimensional images of the interior of foods using sources such as X-rays, nuclear magnetic resonance or even visible light. The fact that the food can be scanned under normal environmental conditions without any preparation techniques makes tomography a powerful tool. Recent developments in tomography technologies have enabled systems that can detect spatial variations of food structure and composition at micrometer and nanometer scales. Tomographic techniques covered in InsideFood are X-ray computed tomography (nano- and micro-CT), high-resolution optical coherence tomography (OCT), and magnetic resonance (micro-) imaging (MRI).
Micro- and nano-CT: 3-D of food microand nanostructures
X-ray CT enables the non-destructive visualisation of the internal structure of objects. The first, mainly medical, CT scanners had a pixel resolution in the order of one millimetre. In the 1980’s, after some technological advances towards micro-focus X-ray sources and high-tech detection systems, it was possible to develop a micro-CT (or μCT) system with nowadays a pixel resolution 1,000 times better than the medical CT scanners. The technique of X-ray (micro)-CT is based on the interaction of Xrays with matter. When X-rays pass through an object, they will be attenuated in a way depending on the density and atomic number of the object under investigation and of the used X-ray energies. By using projection images obtained from different angles, a reconstruction can be made of a virtual slice through the object. When different consecutive slices are reconstructed, a 3-D visualisation can be obtained.
Within InsideFood, nano-CT has visualised foam, cereals and fruit structures at scales below one micrometer (Figure 3). Foamed food was scanned by micro and nano-CT at a range of resolutions, from 20 down to 0.5 microns, strongly affecting 3-D scan results. At the lowest resolution, a rather bulky tissue was observed in which only a few large air inclusions are detected. Increasing the scan resolution revealed distinct air spaces and foam matrix membranes, resulting in an important rise of measured porosity. By imaging samples at submicrometer pixel resolution, even smaller pore sizes were detected. A gradual increase in matrix connectivity was detected when measuring at increased resolution. This parameter is strongly affected by the amount of (small) bubbles that can be detected. Nano-CT provides complementary structural information (in particular the pore size distribution) to micro-CT but care has to be taken to provide representative samples without damaging the structure. Therefore, scan results of high resolutions CT are critically dependent on a welldefined sampling and scanning protocol.
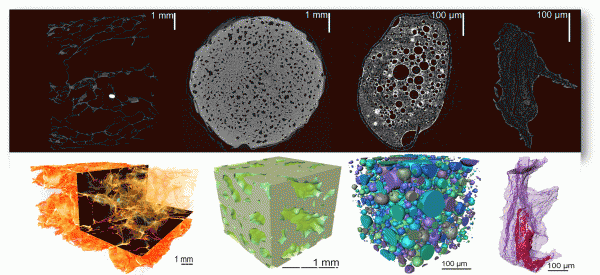

Figure 3 3-D food microstructure visualised with micro and nano-CT, from left to right: crispy bread, apple, foam, breakfast cereals. Upper pictures are 2-D reconstructed virtual slices, lower pictures are 3-D reconstructions of the micro- and nanostructure. Images were acquired with Skyscan 1172 (1-5 μm pixel resolution) and Skyscan 2011 nano-CT (0.5 μm pixel resolution). Copyright: K.U.Leuven & Skyscan, Belgium & VSG, France
For the first time, K.U.Leuven (BE) has recently visualised the 3-D microstructure of dense moist products nondestructively with micrometer resolution and good contrast between the wet phase and air spaces using micro-CT). With nanotomography using advanced synchrotron radiation X-ray tomography it was even possible to show individual cells, pores and cell walls in 3-D (Figure 3).
Optical coherence tomography: visualisation of surface structures
Optical coherence tomography (OCT) is a relatively young and non-invasive high resolution imaging technique which allows for two or three dimensional images to be acquired in situ and in vivo. So far, the main interest for OCT has been directed towards biomedical diagnostics, like the detection of retinal diseases. OCT is based on the physical phenomenon of white light interferometry and therefore well suited to image layered structures. The image contrast is due to small inhomogeneities in the refractive index of the material. For OCT measurements, the sample is commonly illuminated with light in the near infrared. The backscattered and reflected photons from the sample are collected and brought to interfere with a reference beam. From the interference pattern, the location of the scattering sites within the sample can be determined. Because of the coherent detection of the backscattered photons, the method is very sensitive and even suitable for turbid materials – the penetration depth is several times higher than that obtained with, e.g., confocal microscopy. Spectral domain (SD) OCT offers advantages in terms of imaging speed and sensitivity, enabling video rate imaging and in-line applications. On the other hand, the time-domain (TD) approach permits the application of dynamic focusing and shows a constant sensitivity over the whole depth range.
The quality and thickness of the natural wax layer is one important parameter throughout the storage and shelf life of apples that can be inspected by OCT (Figure 4). The wax layer and lenticel structures could clearly be visualised in addition to subsurface structures such as pores. On extruded breakfast cereals, it was possible to visualise the structure and effectiveness of coatings during rehydration processes (Figure 5).


Magnetic Resonance Imaging: fast screening of internal defects
Nuclear magnetic resonance (NMR) studies magnetic nuclei such as protons by aligning them with an applied constant magnetic field and perturbing this alignment using an alternating magnetic field. In NMR relaxation, the different time constants for the nuclei to return to their thermodynamic rest state after an electromagnetic pulse is applied is measured. The time constants are related to, amongst others, concentrations of the magnetic nuclei but also their mobility. In imaging mode, MRI provides a picture that contains combined spectroscopy and relaxometry information, both spatially resolved.
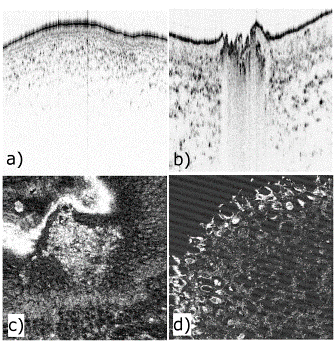

Figure 5 OCT cross sections of uncoated and coated extruded breakfast cereals from Nestlé, left hand side and right hand side, respectively. The images were acquired with the SD-OCT system. Copyright: RECENDT, Austria & Nestlé, Switzerland
Cryo micro-MRI was used down to a resolution of 16 microns to visualise the microstructure and water status of tissues of apples. Micro-MRI provided insight in the water relations of sound and affected tissues of apples, through differences in MRI characteristics (T2, proton density and diffusion coefficients). Differences between different tissues in the apple could also be clearly visualised. In multi-slice-multi-echo mode, micro-MRI was effectively used to followin situ the dehydration process of tissues in relation to microstructural features. To this end, a controlled dry flow of heated nitrogen gas was passed over the sample inside the coil. MRI was also used on intact fruits with protocols to obtain fast 3-D scanning of the fruits in less than one second (Figure 6).
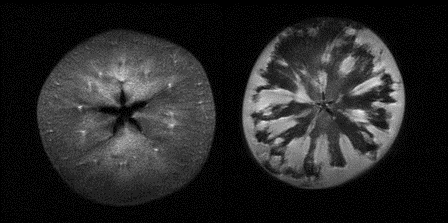

Figure 6 Fast MRI for detection of internal apple disorders: a healthy apple (left) can be esaly distinguished from a watercore apple (right). Fast Imaging with Steady state Precession (FISP) provided very fast 3-D maps of the internal disorders (less than 1 s). Copyright: UPM, Spain & Bruker, Germany & IFR, UK
The Next Step: multiscale analysis of food properties
Using the 3-D information from the different methods it now becomes feasible to analyse food properties (texture, mass transfer properties) based on the nano and microscopic structural features of the food. To this end, K.U.Leuven has developed a multiscale model that basically calculates the macroscopic food properties based on their composition and structure. Figure 7 provides an example of the approach that uses the 3-D microstructure of an apple to calculate the diffusion properties that are important for optimal storage of the fruit.
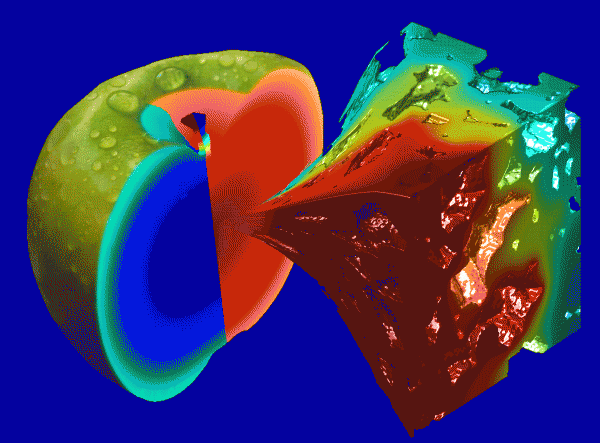

Figure 7 Multiscale calculation of the gas diffusion in an apple based on the apple microstructure. In the apple cross section, the distribution of oxygen (left, low concentration in the centre) and carbon dioxide (right, high in the centre) is plotted. These macroscopic profiles are the result of calculations on the microscale and are determined by the microstructural configuration of the cells (outset). Copyright: K.U.Leuven, Belgium
Further information
Further information including presentations, newsletters and videos can be found at http://insidefood.eu/INSIDEFOOD_WEB/UK/ Publications.awp
Acknowledgments
This publication has been produced with the financial support of the European Union (FP7/2007-2013 under grant agreement n° 226783). The opinions expressed in this document do by no means reflect the official opinion of the European Union or its representatives.
About the Author
Pieter Verboven is the exploitation manager of InsideFood. He obtained a PhD in Applied Biological Sciences at the Catholic University (K.U.Leuven) in Leuven, Belgium in 1999. He further specialised as a postdoctoral researcher in the field of computational engineering of food processes at the same university. Since 2007, he has been the industrial research manager at the division MeBioS of the Biosystems department. He is responsible for industrial projects and contracts to provide solutions for design and optimisation of industrial agro-food applications by means of biofluidics simulation. He is author of more than 80 scientific publications and more than 10 book chapters. email: [email protected]


