What’s inside cheese?
- Like
- Digg
- Del
- Tumblr
- VKontakte
- Buffer
- Love This
- Odnoklassniki
- Meneame
- Blogger
- Amazon
- Yahoo Mail
- Gmail
- AOL
- Newsvine
- HackerNews
- Evernote
- MySpace
- Mail.ru
- Viadeo
- Line
- Comments
- Yummly
- SMS
- Viber
- Telegram
- Subscribe
- Skype
- Facebook Messenger
- Kakao
- LiveJournal
- Yammer
- Edgar
- Fintel
- Mix
- Instapaper
- Copy Link
Posted: 31 January 2005 | Dr Gerard Downey, TEAGASC, The National Food Centre, Ireland | No comments yet
NIR is widely used in food analysis with application to many sectors. In this article Gerry Downey addresses its value to the dairy industry.
The dairy industry is of enormous financial significance in Ireland and many other European countries and it is currently undergoing a period of large scale rationalisation into many fewer but larger production units. Concomitant decreases in employment numbers exerts pressure on the manufacturing operations to maintain high levels of quality in the wide array of products that the industry produces. Near infrared has obvious potential for addressing this issue, yet its use by the dairy sector is far from extensive. We have recently been involved in a study of the use of NIR for monitoring the quality of two types of cheese of commercial importance: Cheddar cheese and processed cheese. The results of this three-year study are currently being published but some highlights of already released material are described below.
NIR is widely used in food analysis with application to many sectors. In this article Gerry Downey addresses its value to the dairy industry. The dairy industry is of enormous financial significance in Ireland and many other European countries and it is currently undergoing a period of large scale rationalisation into many fewer but larger production units. Concomitant decreases in employment numbers exerts pressure on the manufacturing operations to maintain high levels of quality in the wide array of products that the industry produces. Near infrared has obvious potential for addressing this issue, yet its use by the dairy sector is far from extensive. We have recently been involved in a study of the use of NIR for monitoring the quality of two types of cheese of commercial importance: Cheddar cheese and processed cheese. The results of this three-year study are currently being published but some highlights of already released material are described below.
NIR is widely used in food analysis with application to many sectors. In this article Gerry Downey addresses its value to the dairy industry.
The dairy industry is of enormous financial significance in Ireland and many other European countries and it is currently undergoing a period of large scale rationalisation into many fewer but larger production units. Concomitant decreases in employment numbers exerts pressure on the manufacturing operations to maintain high levels of quality in the wide array of products that the industry produces. Near infrared has obvious potential for addressing this issue, yet its use by the dairy sector is far from extensive. We have recently been involved in a study of the use of NIR for monitoring the quality of two types of cheese of commercial importance: Cheddar cheese and processed cheese. The results of this three-year study are currently being published but some highlights of already released material are described below.
Processed cheeses are usually produced from selected natural cheeses of different degrees of maturity and emulsifying salts. They are manufactured by blending those ingredients then heating and mixing them into a homogeneous mass. In addition to natural cheese, other dairy ingredients (butter, whey powder, skimmed milk powder, cream) and non-dairy ingredients (ham, fish, vegetables) may be included in the blend. According to the European Dairy Association approximately 200,000 tonnes of European natural cheese was used in 2002 to produce 560,000 tonnes of processed cheese and processed cheese preparations.
Samples
In a research project that finished at the end of 2004, we examined the potential for NIR spectroscopy to provide information on compositional and sensory properties of processed cheeses. The processed cheeses were manufactured at the Teagasc pilot plant facility at the Moorepark research centre and stored for 28 days at 4ºC. Samples were removed after 14 and 28 days for sensory and proximate analysis by standard methods. Moisture was determined using AOAC 926.08 (1990) standard method with the substitution of an air-oven for the recommended vacuum oven. Fat in the processed cheese samples was determined using the IDF 5B:1986 solvent extraction (Röse-Gottlieb) method. The salt content of processed cheese was calculated from the amount of disodium phosphate added and the salt contents of the butter (2% w/w) and natural cheese (1.77% w/w) incorporated. Owing to the effect of temperature on the spectral response of high moisture samples, such as cheese, all samples were equilibrated to room temperature (20-24°C) prior to NIR analysis. Three cylinders (3.00cm height and 3.8cm diameter) of cheese were removed from each sample with the aid of a cork borer. Each cylindrical sample was then placed in a circular reflectance cup and sliced to the cup depth (1.00cm) using a flexible cheese wire. This system is shown for Cheddar cheese in Figure 1.
Each of the three replicate sub-samples were scanned in triplicate with rotation of the sample cup through approximately 120° between successive scans. The average of all nine spectra of each cheese sample was subsequently used for calibration development. Cheese samples were equilibrated to room temperature before spectral collection and exhibited temperature variations of about 4-5ºC. Figures 2 and 3 show the moisture and fat content of the experimental processed cheeses. These represent ranges slightly larger than those used commercially in order to facilitate calibration development. While the histograms do not reveal uniform or normally-distributed compositional values, this was not considered a disadvantage for calibration development.
Representative visible and NIR reflectance spectra of processed cheeses with low, medium and high moisture contents (all at a constant 2% salt level) are shown in Figure 4. A number of discrete maxima can be observed in the plots. Three of these have been ascribed to water: 970nm, 1450nm (second and first overtone of the O–H stretch vibration) and 1940nm (a combination of O–H stretch and deformation). Bands at 1208nm (a –CH stretch second overtone), 1728 and 1765nm (first overtone of the –CH stretch) and 2310 plus 2345nm (combined –CH stretch and deformation band) arise from fat components.
Results
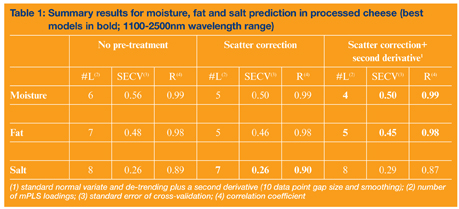
In total, 15 calibration models were developed for each of the three constituents (moisture, fat and salt). Various wavelength ranges and data pre-treatments were investigated. The correlation coefficient (R), standard error of cross-validation (SECV) and number of PLS loadings for each of the preferred models developed are shown in Table 4. A number of general comments may be made about the data in this Table. Firstly, correlation coefficients obtained for both moisture and fat were very high. The lowest value was 0.80, but 24 of the 30 were ≥ 0.97; little variation with respect to the wavelength range or data pre-treatment used was detected. Correlation coefficients (R) obtained for salt were lower than those obtained for moisture and fat and ranged from a minimum of 0.67 to a maximum value of 0.90. Results for protein prediction are not shown; these were very poor and unlikely to be of commercial utility. This disappointing result may arise from the narrow range in protein content designed into the cheeses (16-22.2% w/w).
Regression plots for the preferred models are shown in Figures 5-7. These reveal clustering arising from the discontinuous spread of the constituent values and, particularly in the case of fat and moisture, little dispersion around the fitted regression line is obvious. The greater scatter in the salt regression plot probably arises, in part, from inaccuracy in the reference method results, but interferences from other cheese components may also play a part. Salt, of course, has no signal in the NIR region but may be measured accurately from shifts in water absorption maxima, provided the sample matrix shows little variability.
Conclusions
In summary, the models developed during this study are better than those for equivalent cheeses previously published and represent tools of great potential utility for quality control in processed cheese manufacturing. (A complete description and discussion of this work is contained in JNIRS, 12, 149-157, 2004.) Further work is in progress to model sensory and textural properties of processed and Cheddar-type cheese by NIR – watch this space for future updates.
Acknowledgments
Gerry Downey wishes to acknowledge financial support for this work from the Irish Department of Agriculture and Food.
All figures and tables are reproduced by permission of NIR Publications.
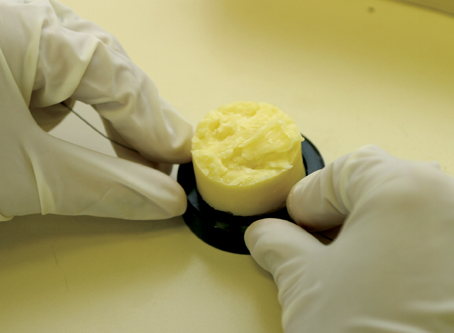

Figure 1: Cheese disc preparation (Cheddar-type cheese shown)
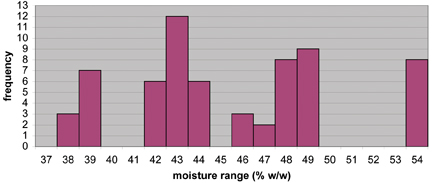

Figure 2: Distribution of moisture content of experimental processed cheese samples
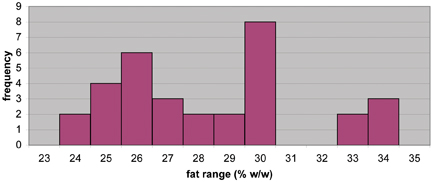

Figure 3: Distribution of fat content of experimental processed cheese samples
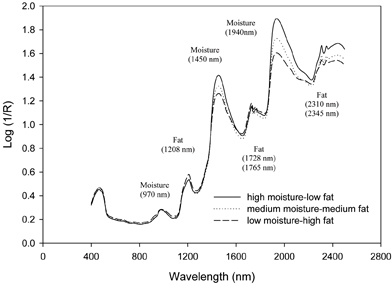

Figure 4: Representative NIR reflectance spectra of 3 processed cheese samples with the same salt level (2% w/w)
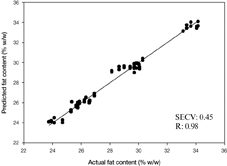

Figure 5: PLS regression of actual versus predicted fat values (% w/w) (1100-2500 nm, 2nd derivative, SNV+DETREND; 5 loadings, R= Correlation coefficient; SECV= standard error of cross-validation)


Figure 6: PLS regression of actual versus predicted moisture values (% w/w) (1100-2500 nm, 2nd derivative, SNV and DETREND; 4 loadings; R= Correlation coefficient, SECV= standard error of cross-validation)
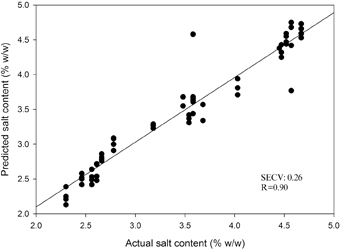

Figure 7: PLS regression of actual versus predicted salt values (% w/w) with outliers samples (1100-2500 nm, SNV and DETREND; 7 loadings; R= Correlation coefficient, SECV= standard error of cross-validation)
