Using near infrared (NIR) spectroscopy for the non-invasive assessment of food
- Like
- Digg
- Del
- Tumblr
- VKontakte
- Buffer
- Love This
- Odnoklassniki
- Meneame
- Blogger
- Amazon
- Yahoo Mail
- Gmail
- AOL
- Newsvine
- HackerNews
- Evernote
- MySpace
- Mail.ru
- Viadeo
- Line
- Comments
- Yummly
- SMS
- Viber
- Telegram
- Subscribe
- Skype
- Facebook Messenger
- Kakao
- LiveJournal
- Yammer
- Edgar
- Fintel
- Mix
- Instapaper
- Copy Link
Posted: 4 September 2007 | Dr. Sam Millar, Campden & Chorleywood Food Research Association | No comments yet
Near infrared (NIR) spectroscopy offers users a rapid, non-destructive means of assessing a range of different food ingredients and finished products. Since its commercial development as a technique in the 1970s, it has been widely applied in a number of food sectors, particularly those related to cereal products. As instrumentation and data analysis techniques have developed, new approaches for the use of NIR have been generated through which its wider adoption within the food industry is ongoing. In addition to the work on NIR at CCFRA in the established areas of cereal compositional analysis, recent projects have also demonstrated a number of new approaches. Within these, the technique has been applied to other food matrices as well as to problems of a more complex nature for food materials derived from cereals.
Near infrared (NIR) spectroscopy offers users a rapid, non-destructive means of assessing a range of different food ingredients and finished products. Since its commercial development as a technique in the 1970s, it has been widely applied in a number of food sectors, particularly those related to cereal products. As instrumentation and data analysis techniques have developed, new approaches for the use of NIR have been generated through which its wider adoption within the food industry is ongoing. In addition to the work on NIR at CCFRA in the established areas of cereal compositional analysis, recent projects have also demonstrated a number of new approaches. Within these, the technique has been applied to other food matrices as well as to problems of a more complex nature for food materials derived from cereals.
Near infrared (NIR) spectroscopy offers users a rapid, non-destructive means of assessing a range of different food ingredients and finished products. Since its commercial development as a technique in the 1970s, it has been widely applied in a number of food sectors, particularly those related to cereal products. As instrumentation and data analysis techniques have developed, new approaches for the use of NIR have been generated through which its wider adoption within the food industry is ongoing. In addition to the work on NIR at CCFRA in the established areas of cereal compositional analysis, recent projects have also demonstrated a number of new approaches. Within these, the technique has been applied to other food matrices as well as to problems of a more complex nature for food materials derived from cereals.
This article describes three separate areas of research within which new approaches for NIR analysis have been investigated. In each case, they represent either food industry problems where opportunities for enhanced control during processing may be envisaged or situations where the NIR spectra themselves offered a means of understanding key constituent interactions in the food systems studied.
Principles of NIR analysis
The term spectroscopy describes techniques which study the interaction of radiation (light) with matter. Human beings are sensitive to light in the wavelength range 400-700nm, but it is the region at longer wavelengths beyond this which is used for NIR analysis. Typically, NIR instruments cover some or all of the wavelength range 700-2500nm, within which information relating to specific molecular bonds such as C-H, O-H and N-H may be found. These bonds form the basis of many of the main components of foods such as proteins, carbohydrates, fats and water and thus may be used to determine their relative quantities. The molecular information contained within NIR spectra represents overtone and combination bands, while the fundamental vibrations may be found in the mid infrared (2500-25000nm). While this ensures that NIR generally is less applicable than mid infrared approaches for determining the detailed structure of molecules, the ease with which samples may be prepared for and presented to NIR instruments ensures that it is seen as a more practical option for routine industrial analysis.
In addition to the selective absorption of energy by these bonds, the physical characteristics of materials also interact with the incident radiation, leading to a mechanism for determination of the structure of many food ingredients or products. However, as a result of NIR spectra being affected by changes in composition as well as structure, it is often not possible to extract the relevant compositional information from an individual spectrum directly. Rather, calibrations are developed which relate the NIR response to the parameter of interest for a collection of samples. These samples will typically represent not only a range of values for the parameter of interest, but should also include variation in other aspects of the samples to which NIR may be sensitive. An example of such an approach is to include samples of wheat flour having different particle size distributions when generating a calibration for protein content. This is to ensure that the resultant calibration can determine protein content accurately irrespective of the normal variation in flour granularity.
Calibrations are based on the principles of multiple linear regression within which several multiplicative terms along with a single intercept term are used in equations having the general form:
Where Y^ is the predicted value
a is the intercept constant
b1 to bn are the multiplicative constants
x1 to xn are the responses used for the prediction
In practice, it is likely that the responses used (x1 to xn) will not be individual wavelengths but will be variables generated as a result of multivariate analysis techniques such as principal components analysis (PCA) or partial least squares (PLS). These techniques are used to reduce the large number of wavelengths and responses within a typical NIR calibration set to a smaller number of uncorrelated variables which describe the main areas of spectral variation observed. As such, these approaches are powerful ways of developing more robust calibrations within which the selection process for the optimum calibrations are clearly defined. In addition, techniques such as PCA may also be used to investigate how different samples in a dataset may be grouped in relation to their spectral properties.
Molecular changes in starch during retrogradation
Starches from a range of sources are common food ingredients and form a major part of most bakery products. Starches classically contribute to food structure through the swelling and gelation of individual granules when subjected to heating in aqueous systems. During subsequent storage, however, ordered regions are formed which lead to firming of the gel structure, a process known as retrogradation. This is the basis for the change in texture underpinning the staling of bakery products such as bread.
The changes which occur during retrogradation have previously been studied by both mid infrared and near infrared spectroscopy (Goodfellow and Wilson, 1990; Wilson et al., 1991). The former has been used to assess molecular interactions while in the latter case, changes in light scattering as a function of retrogradation were investigated.
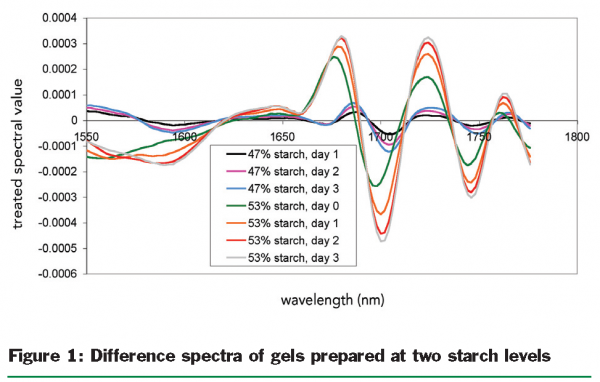
To study whether NIR may be used to assess the molecular interactions directly, wheat starch gels were produced in a sealed NIR cell which, following cooling, was presented to a Foss NIRSystems 6500 scanning monochromator spectrometer. Gels were produced at two levels of starch concentration (47 and 53 per cent) and the retrogradation of identically treated samples produced outside the NIR cell was confirmed using Differential Scanning Calorimetry (DSC). NIR spectra were transformed to mathematical derivatives to allow subtle changes in absorbance bands to be better resolved as well as to remove any effects due to changing light scattering properties of the gel. The development of molecular interaction during storage was highlighted by calculating difference spectra, i.e. subtracting the spectrum derived from a 47 per cent starch gel on the day of production.
The spectral features shown in the difference spectra (Figure 1) demonstrated evidence of a difference in magnitude consistent with the differences in starch concentration used as well as evidence of progressive changes with increasing storage time. These were particularly marked in the region around 1700nm, a part of the spectrum previously assigned to vibrations due to C-H stretch. This supports previous work using mid infrared spectroscopy where changes in C-H stretching were also shown to correlate well with crystallinity data from X-ray diffraction (Bulkin et al., 1987). Interestingly, it had been expected that regions associated with hydrogen bonding would be useful in assessing retrogradation by NIR as these had previously been identified by Wilson et al. (1991). However, the sensitivity of the NIR spectrum to sample temperature in these regions precluded robust analysis on this occasion. As such, the use of NIR to assess changes in C-H stretch during starch retrogradation seems to offer a feasible and suitably robust approach for industrial use.

Assessing the freeze-thaw status of chicken breasts
The way in which meat has been handled prior to its arrival at point of sale is an important consideration for retailers in ensuring safety and optimal quality for consumers. Spectroscopic approaches have previously been applied to assess the tenderness of beef (Venel et al., 2001) as well as to generate a method for discriminating between fresh and previously frozen beef (Downey and Beauchêne, 1997). As part of ongoing work at CCFRA, an evaluation of the impact of different storage approaches on the texture of chicken breast fillets was undertaken. In addition to texture analysis by Warner Bratzler shear test, NIR spectra were also collected and used to assess whether spectroscopy-based techniques may be used to classify chicken breast fillets on the basis of their previous storage history.
Chicken breasts were treated under four regimes: chilled storage at 2°C, blast freezing, immersion freezing and slow freezing. Each freezing regime was followed by a four day holding period prior to 24 hours thawing at 2°C. The chilled samples were obtained as fresh samples on the relevant day of analysis. NIR spectra were collected using a Perten DA-7000 diode array spectrometer and the potential grouping of samples with respect to their spectral properties was assessed using PCA (Figure 2).
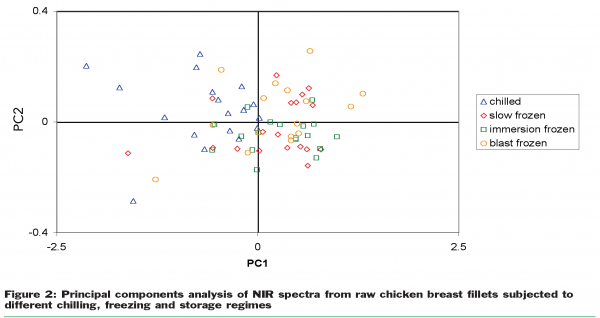

The clustering is relatively poorly defined, although there is some evidence that the samples which had not been frozen had lower values for PC1 than the majority of samples which had been frozen. However, this figure only shows the first two principal components and so does not necessarily indicate the optimum basis for discriminant analysis. To further assess the potential of the NIR approach, the first three principal components were subjected to binary logistic regression to determine whether the individual samples in pairs of frozen and non-frozen samples would be correctly classified. The results from this showed that correct classification was achieved in 94 per cent of cases using this approach. As a result, it may be concluded that the NIR method shows promise as a screening technique for such an evaluation.
Determining the particle size distribution of flour
As a result of the information included in NIR spectra related to the physical structure of materials, NIR calibrations have previously been developed against measures of particle size. One such example has been calibrations based on the proportion of flour or ground wheat retained on a sieve of defined aperture. This has been an important use of NIR technology for flour millers, helping them not only to assess the particle size of the ground material but also to infer the endosperm texture of the starting wheat. In many cases, however, the average particle size may not yield sufficient information and so NIR has now been applied at CCFRA to assess the particle size distribution of flour rather than simply the proportion passing through a single sieve.
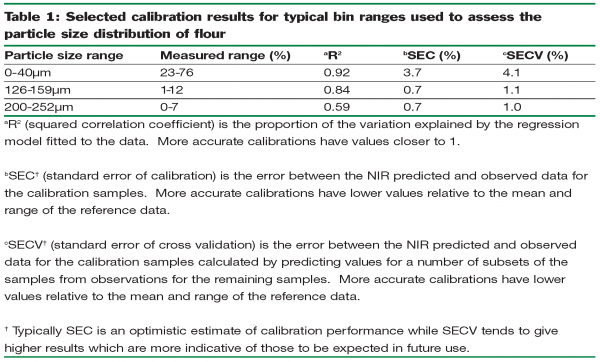
Flour samples representing different starting wheat varieties and different stages of the milling process were sourced and NIR spectra collected. The particle size distribution of the samples was then determined by laser diffraction. Calibrations relating the data generated by both measurement techniques were derived using PLS regression for each of a number of particle size ‘bins’.
The calibrations derived (Table 1) show that NIR has the capacity to be used as a means of determining particle size distribution for flour rather than simply mean particle size. While each of the bins assessed requires a separate calibration, these may all be applied simultaneously during routine analysis to allow an estimation of particle size distribution to be made. The performance of this calibration also appears acceptable, although there is some evidence that the performance for larger particles is lesser. Nevertheless, the range 0-250µm covered is one in which the majority of flour particles fall and so it is not anticipated that poorer performance beyond the upper limit would be seen as practically significant.

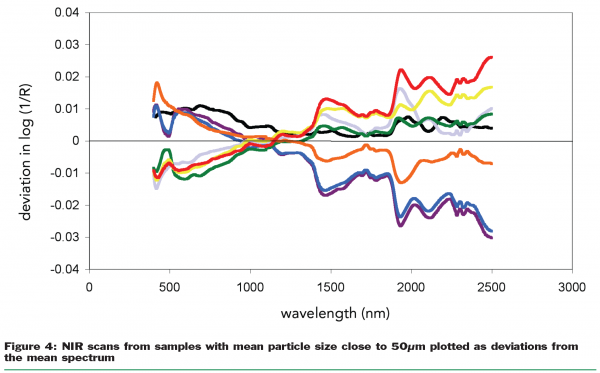
Further supporting evidence for the effect of flour particle size distribution on NIR spectra was obtained by selecting a sub-set of flour samples having very similar mean particle sizes but differing particle size distributions (Figure 3).
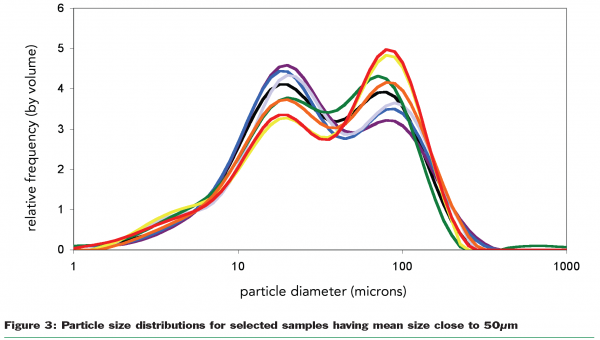

The NIR spectra for each of these samples were then subtracted from the mean spectrum for the entire sub-set (Figure 4) to assess whether spectral features varied as a function of the different distributions rather than simply mean particle size. The results demonstrate not only that differences in the spectra were observed but that the distribution around the mean showed a broadly similar progression as that for the particle size distribution (each sample is colour-coded consistently in each figure).

Given that NIR is widely used by cereal processors to assess the composition of their raw materials and products, further development of the technology to broaden the measurements which may be undertaken is a positive step. For flour millers in particular, the potential to assess flour particle size distribution at the same time as other standard parameters is an important new approach.
Summary
The use of NIR spectroscopy is well-established in a number of food industry sectors but it is clear that advances in instrumentation and data analysis approaches make the technique suited to wider application. The topics covered here represent approaches where the basic composition of the material is not the main focus of the analysis. Instead, the desired response is a combination of attributes which contribute to the functionality or acceptability of food products. While such approaches are by nature more challenging than straightforward measurement of composition, they represent exciting new opportunities for more rapid and potentially on-line routes to control food processes and resultant products.
References
Bulkin, B.J., Kwak, Y. and Dea, I.C.M (1987). Retrogradation kinetics of waxy-corn and potato starches; a rapid, raman-spectroscopic study. Carbohydrate Research, 160, 95-112.
Downey, G. and Beauchêne, D. (1997). Discrimination between fresh and frozen-then-thawed beef m. longissimus dorsi by combined visible-near infrared reflectance spectroscopy: a feasibility study. Meat Science, 45(3), 353-363.
Goodfellow, B.J. and Wilson, R.H. (1990). A Fourier Transform IR study of the gelation of amylose and amylopectin. Biopolymers, 30, 1183-1189.
Venel, C., Mullen, A.M., Downey, G. and Troy, D.J. (2001). Prediction of tenderness and other quality attributes of beef by near infrared reflectance spectroscopy between 750 and 1100nm; further studies. Journal of Near Infrared Spectroscopy, 9, 185-198.
Wilson, R.H., Goodfellow, B.J., Belton, P.S., Osborne, B.G., Oliver, G. and Russell, P.L. (1991). Comparison of Fourier Transform mid infrared spectroscopy and near infrared reflectance spectroscopy with differential scanning calorimetry for the study of the staling of bread. Journal of the Science of Food and Agriculture, 54, 471-483.


