Successful application of SGF-Profiling
- Like
- Digg
- Del
- Tumblr
- VKontakte
- Buffer
- Love This
- Odnoklassniki
- Meneame
- Blogger
- Amazon
- Yahoo Mail
- Gmail
- AOL
- Newsvine
- HackerNews
- Evernote
- MySpace
- Mail.ru
- Viadeo
- Line
- Comments
- Yummly
- SMS
- Viber
- Telegram
- Subscribe
- Skype
- Facebook Messenger
- Kakao
- LiveJournal
- Yammer
- Edgar
- Fintel
- Mix
- Instapaper
- Copy Link
Posted: 28 February 2008 | Dr. Manfred Spraul (Bruker BioSpin GmbH), Dr. Peter Rinke (Sure Global Fair International E.V.) | No comments yet
Important tasks of the fruit juice industry are to protect the good and healthy image for its whole product range and protect the market against any unserious producers. In order to assure fair competition, safe products and consumer satisfaction, the fruit juice industry has installed independent and centralised control bodies under the umbrella of EQCS (European Quality Control System).
SGF (SGF INTERNATIONAL E.V. – SURE GLOBAL FAIR) is the biggest member association of and its department, SGF/IRMA (International Raw Material Assurance) and is in charge of controlling the supply market in more than 50 countries worldwide. Facing a very large number of control samples, conventional analyses are limited to spot checks and more or less arbitrary choices of specific aspects to control, due to high costs. Systematic so called “full analyses” are too expensive for any control organisation and for the companies’ own entrance controls. Besides safety controls, the analytical scope should cover the addition of external sugar, water, flavour compounds or cheaper fruit types than the declared ones1,2.
With this is mind, a new approach, based on 1H-NMR-techniques, combined with advanced statistical evaluation, was developed with the intention to pre-select samples for specific conventional and established analyses, and to avoid unnecessary cost for full analyses. The resulting SGF-Profiling (Spin Generated Fingerprint Profiling) can answer to this request by using chemometric comparison of spectrum fingerprints for authenticity control. Meanwhile, the method is successful when used in routine controls. Furthermore, it provides additional benefit, without additional costs, such as quantitative evaluation of specific compounds, e.g. indicator for microbiological spoiling or missing GMP (Good Manufacturing Practice) during process or storage. In some cases, structure analyses of the NMR-technique helps to identify specific problems.
Analytical principle
The SGF-Profiling is providing a full 1H-NMR-spectrum for each sample. In principle, all NMR spectrometers are suitable for this analysis. A 400 MHz spectrometer, with a flow injection cell and an automatic sample preparation unit, was chosen for the work, described here.
For one registered spectrum, different interpretation is performed. Each interpretation of data is carried out by a statistical comparison between a reference spectral database of authentic juices and samples to be reviewed. The system is calibrated with a reference database containing spectra of representative samples, covering the natural variability of the examined sample type. The quality of interpretation depends on representativeness and the number of reference spectra. The database is built up using certified authentic samples of products from the industrial process, all provided by SGF/IRMA. All spectra have to be acquired under identical conditions to ensure comparability.
From the large range of available multivariate statistical methods applied, in the context of metabonomics data analysis, different possibilities of comparison can be used. Different NMR spectra parameter can be entered into mathematical models. The combination of methods can improve sample characterisation and in some cases, final judgment3,4,5.
Individual components are identified and quantified using information from a reference compound NMR spectral base5.
Experimental section
Instrumentation
1H NMR measurements: Bruker AV 400 operating in flow injection (120µl sample volume) at 400 MHz proton resonance frequency. Spectra recorded at 300 K. Automatic sample transfer in flow mode by GILSON 215 liquid handler. (Possible alternative: 5 mm tube mode.)
Collection of samples
Based on the global control activities of SGF/IRMA, inspectors collected authentic fruit juice reference samples from main cultivation areas and varieties. Analysed samples were undergoing the industrial process and different processing technologies were taken into account. Only such authentic samples, taken from the running production, are used for the establishment of the reference database. For each sample, a fully signed documentation including origin and condition of processed fruits, as well as the applied technology, is available to guarantee traceability. All samples are semi finished goods. This review will look at apple- and orange juice products as examples for application possibilities. By now, 244 Orange Juice/ Concentrate and 278 Apple Juice/ Concentrate samples were analysed for model set up.
Sterile samples were stored in aluminium bags at ambient temperature and non sterile samples were stored at -18°C before sample preparation for NMR measurements.
Sample preparation
After thawing, the juice samples were homogenised and centrifuged at 1200 x g for 15 minutes. Concentrates were diluted with demineralised water to a target Brix of 11.2° before centrifugation. For flow injection mode, 900 µl of sample material (10% buffer added to obtain a final sample pH between 3.1 and 3.4) were filled into cryovials (1.8 ml). The buffer used contained 0.1% of TSP (sodium salt of 3-(trimethylsilyl)-propionate acid-d4) and 0.013% of sodium azide.
1H-NMR Spectroscopy parameter
1H-NMR spectra acquisitions were carried out by using the NOESYPR1D6 pulse sequence, with continuous wave presaturation of the water resonance, during the relaxation delay D1 of 10 sec duration and a mixing time of 10 ms and ns= 64. Time domain data were collected into 64 K data points. The acquisition time of AQ = 4 sec was covering a sweep width of SW=20 ppm. An exponential window function, with LB = 1 Hz and zero filling was used, prior to Fourier transformation of the data, with zero filling into 64 K frequency domain points.
Data processing, with standard spectrometer software, was performed. Baseline and phase correction were carried out using an automated processing programme. Measurement procedure, based on the liquid handler or automated flow injection, ran under complete control, by standard automation software.
Preparation of NMR spectra for statistics and chemometrical analysis
Besides inhouse developed scripts for MatLab 7.0, data analysis was performed, mainly with the software package, AMIX 3.6.8. For chemometrical data analysis, spectra were segmented into chemical shift regions. Respective segment integrals were calculated in order to set up so called bucket tables for input into Principal Component Analysis (PCA), combined with discriminant analyses and regression analyses (PLS). Bucketing parameters were adjusted to the specific aspects investigated.
Results and discussion
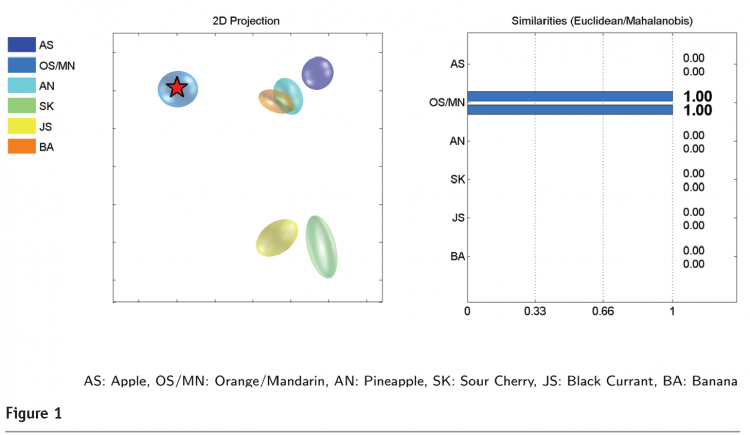
The SGF-Profiling represents a heterogeneous collection of statistical models which can be applied consecutively to one single spectrum, such as specific models for multi fruit type separation, fruit type differentiation between citrus varieties (e.g. citrus sinensis and citrus reticulata), differentiation of product categories (e.g. orange juice and orange juice made from concentrate), or characterisation of compositional differences, for two groups of similar products (e.g. apple juice concentrates from Poland and China). Different answers presented as graphical or numerical results can be compiled in an analytical report by suitable software (“Bruker & SGF – Fruit Juice Screener”, Bruker-Biospin). Only some exemplary extract can be presented here. In cloud presentation of PCA output, the placement of the examined sample spectrum is indicated by a star.
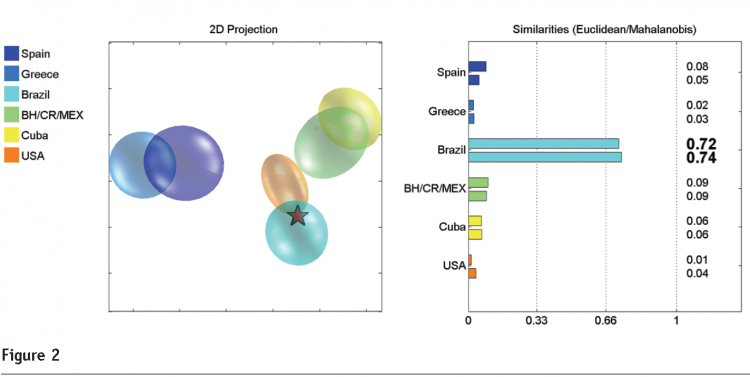
An orange juice concentrate from a Brazilian producer has been allocated to the common group, Orange/Mandarin, and has been separated from other fruit types, as shown in Figure 1. The separation of mandarin (citrus reticulata) from orange (citrus sinenses) is not possible with sufficient precision with this model. A separate model is dedicated to this, which will be discussed later. The same sample is projected in differentiation of geographic origin, as shown in Figure 2. For fruit juice products, the geographic origin is a relevant commercial aspect.
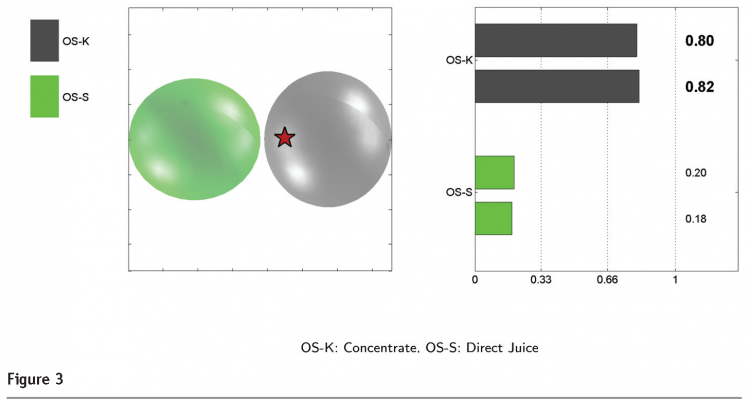
The control of a product type is important in some cases, to detect economic frauds, e.g. if in a direct juice a part of rediltued concentrate is added. Therefore, a special model is presented in Figure 3.
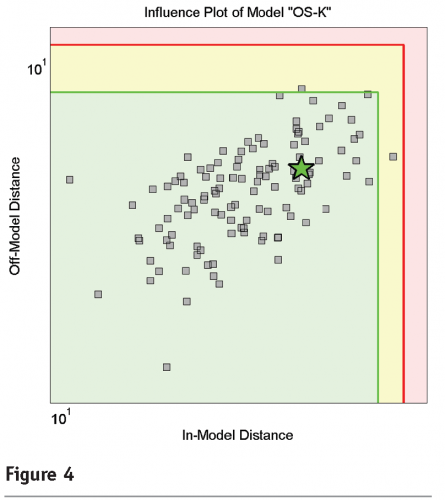
All upper models are comparing different groups and establish similarities, in order to classify any sample. Such models are mainly used to check declared specificities of any product, in comparison with defined alternative possibilities. The SIMCA (Soft Independent Modelling of Class Analogy) model, presented in Figure 4, is comparing a spectrum, only with one specific reference spectra set, in order to determine if spectral sequences with low variability in the reference group. This can indicate a deviation from the target population, without comparing to any defined alternative. The same spectrum, as per previous figures, is calculated here.
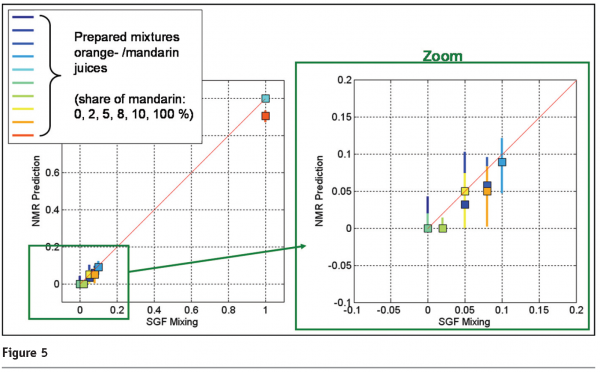
Linearity in chemometrical response is shown in Figure 5. The addition of citrus reticulata (mandarin, clementine) in orange juice is not allowed in Europe. Such an addition is considered as an adulteration. The Ridge Regression curve in Figure 5 is calculated based on pure orange and mandarin juice samples, for which spectra have been combined mathematically with different proportions. Value 0 corresponds to 100% pure citrus sinensis juice, value 1 to 100% pure citrus reticulata juice. In the laboratory, different mixtures from juices, used for modelling, were prepared and measured with the calibration system. The share of reticulata is given on the x-coordinate. The results close to the linearity curve indicate good prediction and are in line with verification by DNA-testing and conventional analyses.
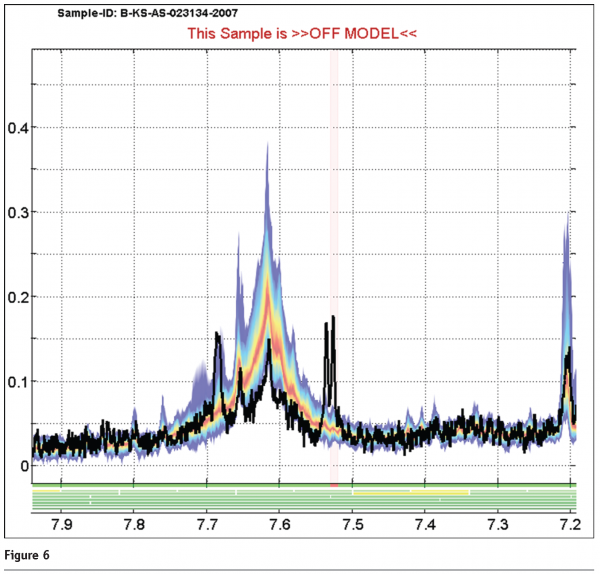
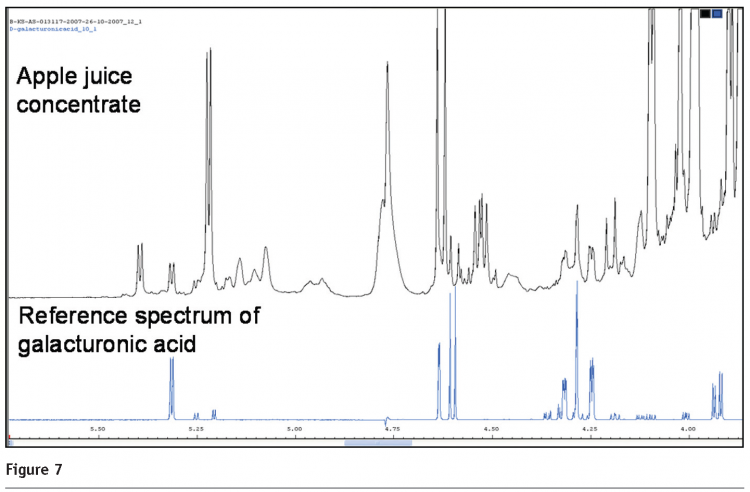
Similar models, as shown for orange juice products, are developed for apple juice products, too. The additional possibility to use structure identification properties in a NMR spectrum for quality assessment is displayed for an apple juice concentrate, as shown in Figure 6. The coloured background presents the distribution of the reference spectra database. Red colours show high number of reference spectrum lines in this area, and the blue colours, low numbers. The black spectrum is the compared sample. Additional signals at 7.52 ppm could be identified as coming from 5-hydroxymethylfurfural (HMF) by measurement of chemical reference material. HMF is a typical Maillard and caramelisation product and its presence in increased concentration indicates an excessive heat treatment or an inappropriate storage condition. Figure 7 shows a spectrum of an apple juice concentrate with increased galacturonic acid concentration. Together, with an unusual sugar profile, measured from the same spectrum, this indicates an excessive enzyme treatment.
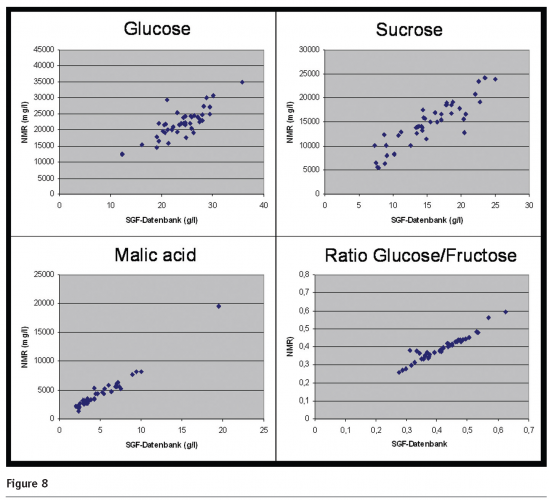
Furthermore, quantification can be carried out. Comparison for some parameters, important in the apple juice profile, are displayed in Figure 8 and compared with conventional analyses, data of the SGF database for compared samples. Considering that analytical errors for both methods could be added when comparing NMR results and conventional analyses by enzyme test kit and/or HPLC, the NMR precision is very sufficient for a pre-screening, prior to conventional analyses.
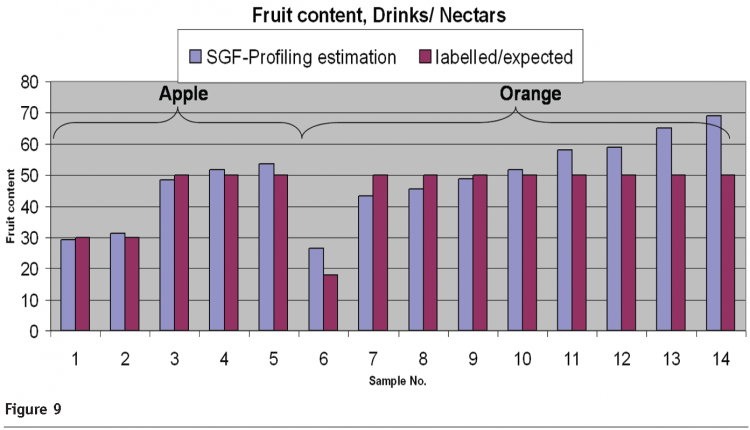
Quantification can be applied without further calibration and reference database to finished goods (bottled consumer goods). Furthermore, other models are transferable like the control of fruit content in products, with less than 100% fruit content such as drinks and nectars. The deviation between the obtained results and the expected fruit contents presented in Figure 9 are within the range of natural variation of fruit juice compounds.
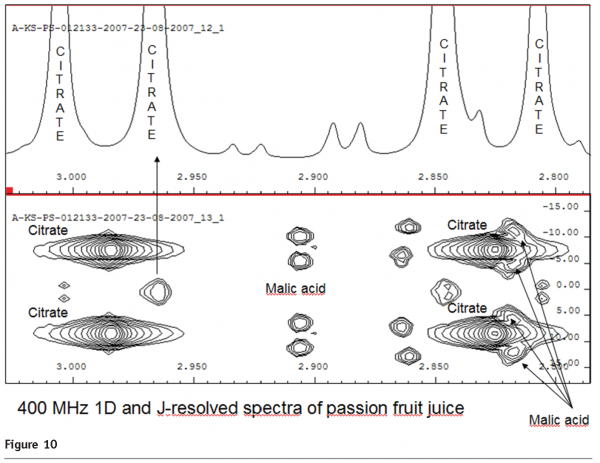
For greater possibility of substance identification, in case of signal overlap, a rapid 2D resolved spectra is recorded in standard routine (see Figure 10).
Conclusion
SGF-Profiling is a high throughput screening for fruit juices. The combination of chemometric modelling with molecule specific signal treatment makes it a powerful tool for fruit juice quality assessment. Specific quality aspects and adulterations can be identified by applying a number of statistical tests on the same spectrum. Fruit and product type differentiation, adulteration by sugar or acid addition, geographical origin and fruit mixtures are predictable. Moreover, a list of substances being present in fruit juice is quantifiable. The application of SGF-profiling in routine controls is enhancing the control density and the amount of detected quality deviations. The pre-selection carried out allows choosing well targeted conventional analyses for a sample. In many cases, it can save higher analytical costs. Therefore, the SGF-profiling is useful and extremely economic in cases where samples need a very fast analytical answer and where a large number of samples should be tested.










References
- H.-J. Hofsommer, Fruit Processing, 1999, 12, 471-479, New Analytical Techniques for Judging the Authenticity of Fruit Juices – An Overview
- S. Koswig, Fruit Processing, 2006, 6, 401-407, Determination of foreign fruit types and fruit varieties – Analyses, Evaluation and Practical Problems
- B.G.M. Vandeginste, D.L. Massart, L.M.C. Buydens, S. de Jong, P.J. Lewi, and J. Smeyers-Verbeke; Handbook of Chemometrics and Qualimetrics, Vol. 2; Elsevier, 1998
- T. Hastie, R. Tibshirani, J. Friedman; The Elements of Statistical Learning – Data Mining, Inference and Prediction; Springer 2001
- P. Rinke, S. Moitrier, E. Humpfer, S.Keller, M. Moertter, M. Godejohann, G. Hoffmann. H. Schaefer, M. Spraul, Fruit Processing, 2007, 1, 10-18, An 1H-NMR-technique for high throughput screening in quality and authenticity control of fruit juice and fruit juice raw material – SGF-Profiling
- S. Braun, H.-O.Kalinowsik, S.Berger: 150 and More Basic NMR Experiments; Wiley-VCH, 1998


