Colour imaging of baked products
- Like
- Digg
- Del
- Tumblr
- VKontakte
- Buffer
- Love This
- Odnoklassniki
- Meneame
- Blogger
- Amazon
- Yahoo Mail
- Gmail
- AOL
- Newsvine
- HackerNews
- Evernote
- MySpace
- Mail.ru
- Viadeo
- Line
- Comments
- Yummly
- SMS
- Viber
- Telegram
- Subscribe
- Skype
- Facebook Messenger
- Kakao
- LiveJournal
- Yammer
- Edgar
- Fintel
- Mix
- Instapaper
- Copy Link
Posted: 7 March 2007 | Martin Whitworth, Campden & Chorleywood Food Research Association | No comments yet
The colour and appearance of baked products are important quality attributes. Printed images of products are often displayed in production areas to illustrate the required appearance, but frequently provide a poor match to the actual product colour.Calibrated imaging methods are now available that enable accurate, consistent images to be taken for product specification and documentation purposes and to be displayed accurately for comparison with production samples. The methods are widely used in the reprographics and textile industries for electronic communication of appearance and have great potential for specification and quality control of appearance throughout the food industry.
The colour and appearance of baked products are important quality attributes. Printed images of products are often displayed in production areas to illustrate the required appearance, but frequently provide a poor match to the actual product colour.Calibrated imaging methods are now available that enable accurate, consistent images to be taken for product specification and documentation purposes and to be displayed accurately for comparison with production samples. The methods are widely used in the reprographics and textile industries for electronic communication of appearance and have great potential for specification and quality control of appearance throughout the food industry.
The colour and appearance of baked products are important quality attributes. Printed images of products are often displayed in production areas to illustrate the required appearance, but frequently provide a poor match to the actual product colour.Calibrated imaging methods are now available that enable accurate, consistent images to be taken for product specification and documentation purposes and to be displayed accurately for comparison with production samples. The methods are widely used in the reprographics and textile industries for electronic communication of appearance and have great potential for specification and quality control of appearance throughout the food industry.
Instrumental measurements of baked product appearance are commonly based on colour measurement using a colorimeter or spectrophotometer. These are available for laboratory and on-line applications and provide objective measurements of colour against defined scales. However, they are limited to measurement of average colour over a fixed area. Photographs and digital images provide a more comprehensive representation of product appearance and are often used as records of trials or to provide images for specification purposes against which production samples can be compared. However, the colour reproduction of photographs is inconsistent unless care is taken to standardise the image capture, printing and viewing conditions.
Affordable technology is now available to calibrate digital cameras, printers and monitors, enabling images to be produced that are an accurate match to actual product appearance. Direct comparisons can be made between images taken on different occasions or in different locations and exact digital copies can be distributed electronically between users. Images can be accurately printed or displayed on a monitor, enabling reliable visual comparisons to be made between production samples and reference standards. Alternatively, image analysis can be used to measure the colour of any chosen region of an image, providing greater versatility than the fixed measurement area of a typical colorimeter. CCFRA has established calibrated imaging facilities in their own laboratories in the UK and Hungary, which are being used to record the appearance of products produced during research and contract work, to make colour measurements for applications such as storage trials and to produce images for clients. The system uses commercially available hardware and calibration software, together with additional image analysis software developed by CCFRA.
Colour definitions
Colours can be matched by combining three carefully defined primary colours in appropriate proportions. The required intensities of each of the primary colours provide a quantitative way of describing a colour by a set of three numbers known as tristimulus values. A standard set of primary colours with specified spectra have been defined by the Commission International de l’Éclairage (CIE) and form the basis of most industrial colour measurements. The tristimulus values are denoted by the values X, Y and Z and can be measured by colorimeters, either by measuring through three filters designed to match the response of the standard observer or by measuring a spectrum and using this to calculate the tristimulus values.
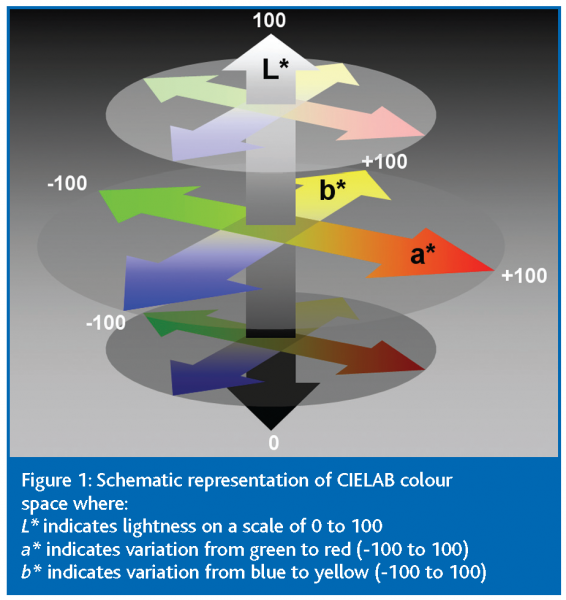
It is common practice to convert X, Y, Z values to an alternative set of three numbers, typically represented as three coordinates of a colour space. These systems are designed to give a more uniform distribution of colours within the space than X, Y, Z and a more intuitive representation of each value. The Hunterlab system was formerly used, but the most widely established system now in use is CIELAB, in which colours are represented by the values L*, a* and b*, shown schematically in Figure 1.
Colour imaging devices such as cameras, computer monitors and printers also represent colours by a combination of primary colours. Digital cameras measure the light falling on each pixel through red, green and blue filters, giving colour values denoted as R, G and B. Monitors display pixels as red, green and blue dots and printers reproduce colours using three or more inks (commonly yellow, cyan, magenta and black). Although some standards exist, the colour characteristics vary between different models of cameras, monitors, printers, inks and paper. To achieve accurate and reproducible colour reproduction, calibration of the devices and standardisation of the imaging conditions are required.
Image capture
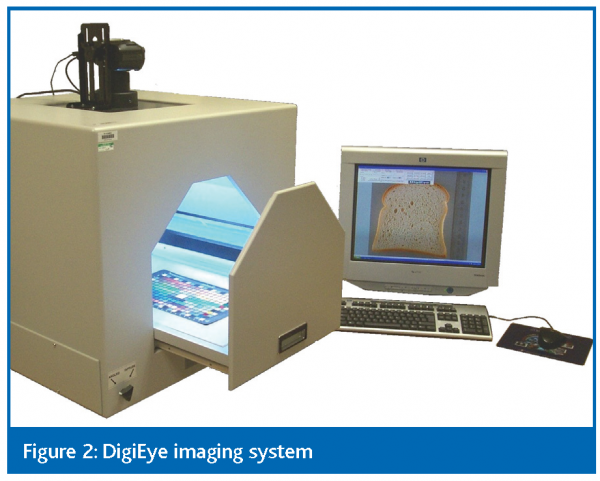
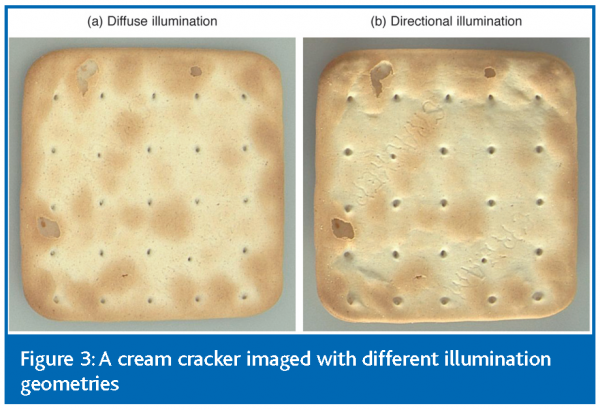
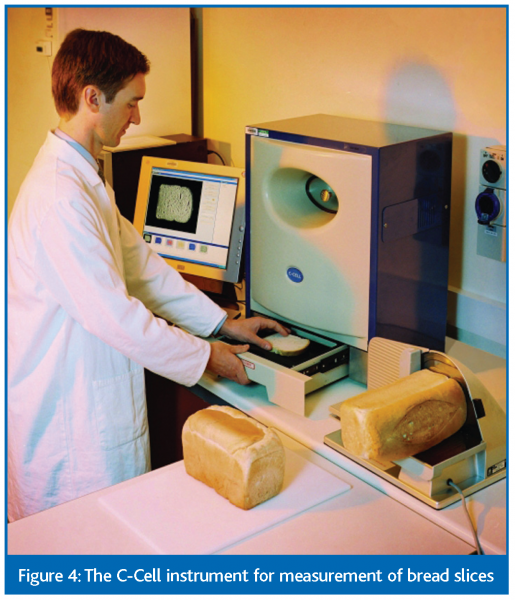
CCFRA uses a DigiEye imaging system (Figure 2) to take calibrated images of baked and other food products. Samples are presented in a neutral grey cabinet and illuminated with white light with a spectrum closely matching the CIE D65 standard commonly used for colour measurements. The instrument can be configured with one of several illumination geometries. Diffuse illumination is suitable for many applications, including imaging of samples with a glossy surface, for which it avoids bright specular reflections. Alternatively, directional illumination can be provided at any of several fixed angles to enable surface texture to be revealed more clearly, as shown in Figure 3. Diffuse illumination provides a clear assessment of the distribution of browning over the surface of a cream cracker and directional illumination enables the text and docking holes to be more clearly seen. The principle of using directional illumination to reveal texture is exemplified by the C-Cell instrument (Figure 4) developed by CCFRA in partnership with Calibre Control International, in which bread slices are illuminated obliquely from two sides to reveal the cell structure at the surface. The system then analyses the slice image to measure factors such as the size distribution, elongation and orientation of bubbles, which can be used to provide objective measurements of bread quality, replacing more subjective visual assessments.
Calibration of image capture
The DigiEye instrument uses a computer to control the settings of a high resolution digital camera. An image of a white card is first taken, enabling any non-uniformity in illumination to be detected and corrected. The system is then calibrated against the CIELAB system by taking an image of a standard test card containing 240 patches of known colour. The system analyses this image to establish a mapping between RGB values and CIELAB values. This can then be used to convert product images to CIELAB space. The procedure enables consistent, traceable results to be obtained for images taken at different times, or using different DigiEye instruments.
Image output
Images taken with a calibrated imaging device can be displayed accurately on a monitor, or printed accurately on a printer for visual comparison with products. A common method is to produce a file known as an ICC profile, which describes the colour characteristics of the chosen display device. ICC profiles are supported by several commercial programs, which can be used to output images accurately.
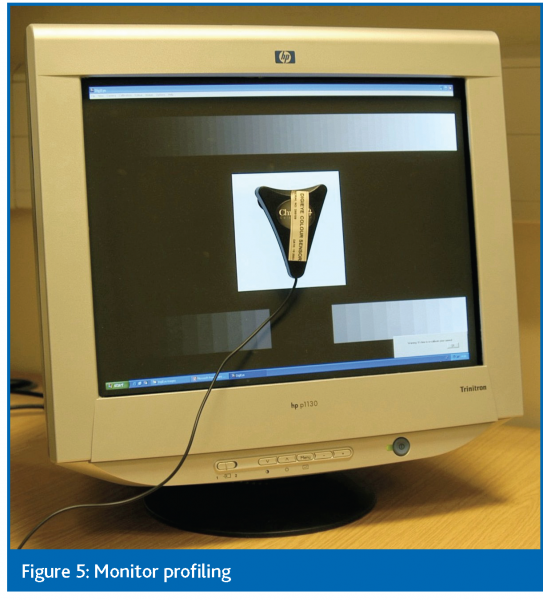
To calibrate a monitor, a colorimeter is attached to the screen (Figure 5). Measurements from this are used to help adjust the brightness and contrast settings of the monitor. A computer programme then displays a series of colours and uses the colorimeter to measure the actual colour displayed. This is used to calculate the characteristics of the monitor. The method can be used to produce an ICC profile using one of many commercial devices available, or to produce a calibration using a proprietary DigiEye method.
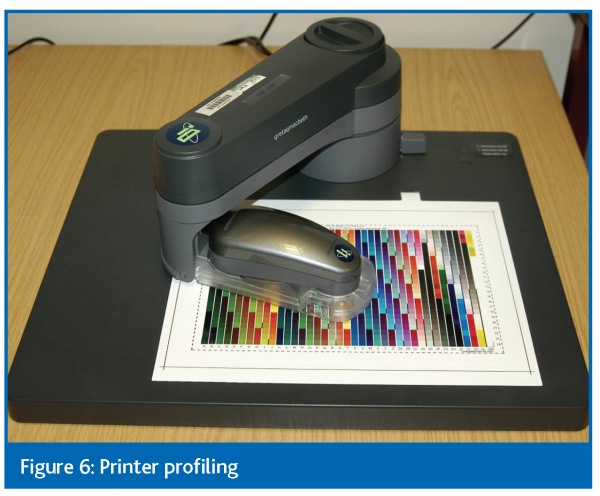
Many printers are supplied with default ICC profiles for use with specified inks and paper. For more accurate results, customised profiles can be produced for individual printers and several companies can provide this as a service. A standard test image containing a large number of coloured patches is first printed using default printer settings. The print is then scanned with a colorimeter to measure the printed colour of each patch. CCFRA uses an automated system (Figure 6) that can measure a test image of 936 colour patches in approximately two minutes. The colour measurements are then combined with data for the reference image to characterise the printer output and to generate an ICC profile.
Light sources for viewing products and images
The appearance of a product depends not only on its reflectance, but also on the spectrum of the light source under which it is viewed. When stating colour measurements, it is therefore necessary to specify the illuminant used. Several standard illuminants have been defined by the CIE. One of the most commonly used for food is D65, which has a spectrum based on average daylight. The DigiEye imaging system used by CCFRA includes light sources that provide a good match to the D65 standard. The system is calibrated to produce colour measurements for this illuminant and prints are designed to be viewed under D65 conditions.
In some cases, even though two objects may match in colour under one light source, differences in the shapes of their spectra may cause them to differ in appearance under a different light source – a phenomenon known as metamerism. For example, a photograph designed to match the appearance of a baked product in a laboratory may be a poor match when used for product assessment under factory lighting. For reliable comparisons, it is therefore important to standardise the light source under which products and images are viewed. Illumination cabinets are available, fitted with light sources that provide a good match to standard illuminants and it is recommended that these, or other standardised illumination conditions, should be used when assessing product appearance.
Image analysis
In addition to the use of images as references for visual assessment of product appearance, image analysis software can be used to make objective measurements of product characteristics such as dimensions, shape, bubble structure and the concentration and distribution of inclusions such as fruit or toppings such as icing, chocolate or flour dusting. A wide range of image analysis systems are already used for laboratory and on-line measurements. By applying these methods to calibrated images, it is also possible to measure colour. Image analysis enables colour measurements to be made for regions of arbitrary size and shape, providing greater versatility than the fixed measurement aperture of a typical colorimeter. Measurements of colour distribution can also be made, in addition to measurements of average colour alone.
Example applications
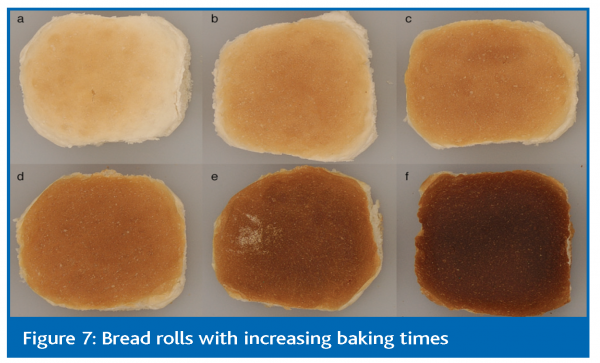
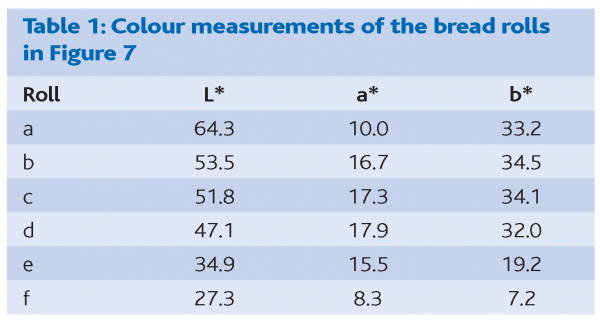
Figure 7 shows a set of images of bread rolls with increasing baking times. Measurements of the colour at the centre of the top surface are shown in Table 1, measured with a colorimeter. As the baking time increases, the rolls get progressively darker as measured by the L* value, but the colour saturation measured by a* and b* increases to a maximum and then decreases again. The hue is initially yellowish (b* much greater than a*), but becomes redder during baking.
These measurements are being used in combination with sensory assessments and calibrated imaging to develop objective methods of defining scales for crust colour and other food colour variations for use by CCFRA’s members. Sets of printed images will be used for visual assessment against the scales and image analysis software will be developed to enable products to be measured against the scale and to include consideration of colour distribution across the product surface.
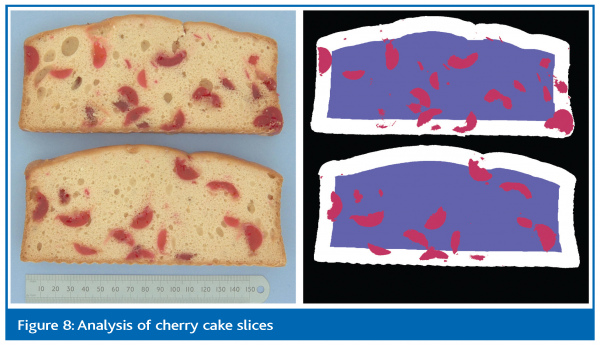
Figure 8 shows an image of two slices of cherry cake. The image was analysed to determine the distribution of colours in CIELAB space. These were used to discriminate the cake from the background and to detect the cherries automatically. The detected cherries are shown in red in the second image. The following measurements were made:
- Slice dimensions
- Crumb colour. This was measured for the region shaded in blue in the second image. The cherries were excluded from the measurement. The crust was also excluded by excluding all pixels within 10mm of the edge (shaded in white). With a colorimeter, it would be necessary to select regions with no cherries for measurement, making a representative average colour measurement more difficult to achieve
- Colour distribution through the thickness of the crust. The distance of every pixel from the edge of the slice was measured. Average colour was then plotted as a function of distance from the edge. This can be measured with a resolution of less than 1mm, providing a precise measurement of crust thickness applicable to a wide range of baked products and not achievable with a colorimeter. The method can be used to compare crust characteristics for top, bottom and side crusts, or for other chosen regions of interest
- Size distribution of cherries
- Distribution of cherries with height. This provides an objective measurement of whether cherries are uniformly distributed, or whether they have sunk
Conclusions
Product images are widely used for specification and documentation of baked product appearance, but colour reproduction is frequently inconsistent. Methods of calibrating digital imaging and display devices are now readily available that provide accurate colour reproduction enabling improved product specification and more reliable quality control. Images can be calibrated against the CIELAB colour system widely used by colorimeters, providing traceability of measurements, and image analysis can be used to provide objective measurements of a wide range of colour and appearance characteristics.
